


The good news is:
• Most of the breadth indicators are in pretty good shape.
Short Term
The market is overbought.
For the past several weeks we have seen 3% to 5% weekly moves in the major indices. The up moves have been a little larger than the down moves so the trend has been up. As of Friday most of the blue chip indices had been up for 4 consecutive days, an event we have not seen since late December when it marked a short term high.
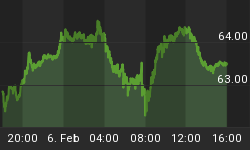
The chart below covers the past 6 months showing the S&P 500 (SPX) in red and an indicator showing the percentage of the last 4 trading days that were up in green. Dashed vertical lines have been drawn on the 1st trading day of each month; the vertical line is red on the 1st trading day of the year. The indicator touches the top of the chart when there have been 4 consecutive up days and it touches the bottom of the screen when there have been 4 consecutive down days.

Intermediate term conditions are different now than they were in November and December, the last time we had 4 consecutive up days in the SPX, still the overbought condition suggests short term risk is high.
Intermediate Term
Most of the technical news last week was good, that is, new lows decreased, new highs increased and the advance - decline lines moved upward. There was, however, a little problem with volume.
The chart below covers the past 9 months showing the SPX in red and a 5% trend (39 day EMA) of NYSE volume of advancing issues (NY UV) in green. NY UV fell off sharply during the sell off a week ago and made a feeble recovery during last week's advance.

The most encouraging numbers from last week were NYSE new highs which ended the week at 156, a pretty good number for the early stages of a bull market.
The next chart covers the past 9 months showing the SPX in red and a 10% trend (19 day EMA) of NYSE new highs (NY NH) in green.
NY NH moved up sharply last week and fell very little the week before when the prices fell.

Seasonality
Good Friday is a market holiday that usually falls in April, so there are usually less than 4 trading Fridays in April. This year Good Friday was in March so April had more Fridays than usual. My program for isolating mid month periods counts Fridays and there are not many examples of April's with 4 Fridays. There are 8 trading days left in April so I am including all of them in the tables this week.
OTC data covers the period from 1963 - 2007 and SPX data from 1928 - 2007. There are summaries for both the 4th year of the Presidential Cycle and all years combined.
Most of the strength comes in the last two days of the month.
Last 8 days of April
The number following the year represents its position in the presidential cycle.
The number following the daily return represents the day of the week;
1 = Monday, 2 = Tuesday etc.
| OTC Presidential Year 4 | |||||||||
| Day8 | Day7 | Day6 | Day5 | Day4 | Day3 | Day2 | Day1 | Totals | |
| 1964-4 | 0.38% 2 | 0.08% 3 | 0.00% 4 | -0.20% 5 | -1.17% 1 | -0.03% 2 | 0.57% 3 | -0.49% 4 | -0.86% |
| 1968-4 | -0.55% 5 | 0.13% 1 | -0.17% 2 | 0.25% 3 | 0.95% 4 | 1.87% 5 | 0.30% 1 | 0.30% 2 | 3.10% |
| 1972-4 | -1.06% 3 | 0.14% 4 | 0.11% 5 | -0.83% 1 | -0.80% 2 | 0.06% 3 | 0.07% 4 | 0.24% 5 | -2.07% |
| 1976-4 | 0.18% 3 | 0.21% 4 | -0.40% 5 | -0.03% 1 | -0.65% 2 | 0.36% 3 | 0.28% 4 | -0.52% 5 | -0.58% |
| 1980-4 | -1.17% 1 | 1.98% 2 | 0.89% 3 | 1.29% 4 | -0.56% 5 | 0.45% 1 | 0.58% 2 | 0.46% 3 | 3.93% |
| 1984-4 | -0.04% 3 | 0.01% 4 | -0.64% 1 | 0.05% 2 | -0.07% 3 | 0.83% 4 | 0.39% 5 | 0.22% 1 | 0.76% |
| Avg | -0.53% | 0.49% | -0.04% | 0.15% | -0.22% | 0.71% | 0.33% | 0.14% | 1.02% |
| 1988-4 | -0.70% 3 | -0.28% 4 | 0.23% 5 | 0.33% 1 | 0.68% 2 | 0.22% 3 | 0.03% 4 | 0.12% 5 | 0.63% |
| 1992-4 | -0.37% 2 | 0.55% 3 | -0.38% 4 | -0.55% 5 | -1.04% 1 | -1.17% 2 | 1.72% 3 | 1.53% 4 | 0.30% |
| 1996-4 | 0.21% 5 | 1.30% 1 | 1.15% 2 | 0.86% 3 | 0.63% 4 | 0.23% 5 | 0.11% 1 | 0.19% 2 | 4.68% |
| 2000-4 | 7.19% 2 | -2.30% 3 | -1.69% 4 | -4.43% 1 | 6.57% 2 | -2.19% 3 | 3.96% 4 | 2.30% 5 | 9.42% |
| 2004-4 | 0.86% 3 | 1.87% 4 | 0.83% 5 | -0.63% 1 | -0.21% 2 | -2.12% 3 | -1.55% 4 | -1.97% 5 | -2.92% |
| Avg | 1.44% | 0.23% | 0.03% | -0.89% | 1.33% | -1.00% | 0.85% | 0.43% | 2.42% |
| OTC summary for Presidential Year 4 1964 - 2004 | |||||||||
| Averages | 0.45% | 0.34% | -0.01% | -0.35% | 0.39% | -0.13% | 0.59% | 0.22% | 1.49% |
| % Winners | 45% | 82% | 45% | 45% | 36% | 64% | 91% | 73% | 64% |
| MDD 4/24/2000 8.20% -- 4/30/2004 6.32% -- 4/28/1992 3.10% | |||||||||
| OTC summary for all years 1963 - 2007 | |||||||||
| Averages | 0.24% | 0.18% | -0.19% | -0.22% | 0.02% | -0.02% | 0.11% | 0.31% | 0.44% |
| % Winners | 53% | 58% | 53% | 53% | 49% | 71% | 62% | 69% | 60% |
| MDD 4/29/1970 11.92% -- 4/24/2000 8.20% -- 4/29/2002 8.07% | |||||||||
| SPX Presidential Year 4 | |||||||||
| Day8 | Day7 | Day6 | Day5 | Day4 | Day3 | Day2 | Day1 | Totals | |
| 1928-4 | -1.48% 5 | -0.98% 1 | 0.52% 2 | 0.42% 3 | 0.72% 4 | 1.08% 5 | 0.36% 6 | 0.00% 1 | 0.64% |
| 1932-4 | -4.49% 5 | 0.84% 6 | 0.33% 1 | 1.49% 2 | 2.45% 3 | -3.83% 4 | -3.32% 5 | 0.00% 6 | -6.52% |
| 1936-4 | 1.71% 3 | -3.03% 4 | 0.28% 5 | 0.55% 6 | -3.86% 1 | -0.14% 2 | -2.94% 3 | 1.77% 4 | -5.65% |
| 1940-4 | 0.41% 1 | 0.74% 2 | -0.41% 3 | 0.08% 4 | -0.90% 5 | 0.08% 6 | 0.25% 1 | 0.58% 2 | 0.83% |
| 1944-4 | 0.17% 5 | -0.08% 6 | -1.02% 1 | 0.17% 2 | 0.60% 3 | 0.43% 4 | 0.51% 5 | 0.00% 6 | 0.77% |
| Avg | -0.73% | -0.50% | -0.06% | 0.54% | -0.20% | -0.48% | -1.03% | 0.47% | -1.99% |
| 1948-4 | 0.90% 4 | 0.64% 5 | -0.13% 6 | -1.40% 1 | 0.06% 2 | 0.13% 3 | -0.32% 4 | -0.26% 5 | -0.37% |
| 1952-4 | -0.46% 2 | -0.42% 3 | -0.21% 4 | 0.47% 5 | 0.17% 6 | -0.13% 1 | -0.25% 2 | -0.72% 3 | -1.57% |
| 1956-4 | -0.36% 4 | 0.40% 5 | -0.23% 1 | -0.82% 2 | -0.36% 3 | 0.85% 4 | 1.05% 5 | 0.81% 1 | 1.35% |
| 1960-4 | -1.23% 3 | 0.27% 4 | -0.31% 5 | -1.01% 1 | 0.33% 2 | 0.00% 3 | -0.87% 4 | -0.35% 5 | -3.17% |
| 1964-4 | 0.05% 2 | -0.06% 3 | -0.14% 4 | -0.78% 5 | -0.50% 1 | 0.69% 2 | -0.25% 3 | -0.30% 4 | -1.29% |
| Avg | -0.22% | 0.16% | -0.20% | -0.71% | -0.06% | 0.31% | -0.13% | -0.16% | -1.01% |
| 1968-4 | -1.27% 5 | -0.55% 1 | 1.22% 2 | 0.15% 3 | 0.31% 4 | 0.30% 5 | 0.26% 1 | 0.13% 2 | 0.54% |
| 1972-4 | -0.52% 3 | -0.15% 4 | -0.14% 5 | -0.64% 1 | -0.99% 2 | -0.21% 3 | 0.15% 4 | 0.58% 5 | -1.92% |
| 1976-4 | 0.44% 3 | -0.33% 4 | -0.67% 5 | 0.14% 1 | -0.56% 2 | 0.27% 3 | 0.00% 4 | -0.48% 5 | -1.20% |
| 1980-4 | -0.75% 1 | 3.64% 2 | 0.29% 3 | 0.65% 4 | 0.73% 5 | 0.46% 1 | 0.21% 2 | 0.41% 3 | 5.63% |
| 1984-4 | -0.67% 3 | 0.08% 4 | -0.77% 1 | 0.81% 2 | 0.37% 3 | 1.04% 4 | -0.26% 5 | 0.10% 1 | 0.69% |
| Avg | -0.55% | 0.54% | -0.01% | 0.22% | -0.03% | 0.37% | 0.07% | 0.15% | 0.75% |
| 1988-4 | -0.69% 3 | 0.11% 4 | 1.45% 5 | 0.89% 1 | 0.56% 2 | -0.05% 3 | -0.45% 4 | -0.49% 5 | 1.33% |
| 1992-4 | 0.02% 2 | -0.11% 3 | 0.44% 4 | -0.63% 5 | -0.14% 1 | 0.16% 2 | 0.71% 3 | 0.71% 4 | 1.17% |
| 1996-4 | 0.23% 5 | 0.44% 1 | 0.57% 2 | -0.22% 3 | 0.42% 4 | 0.09% 5 | 0.11% 1 | 0.00% 2 | 1.63% |
| 2000-4 | 2.87% 2 | -0.98% 3 | 0.49% 4 | -0.32% 1 | 3.30% 2 | -1.09% 3 | 0.27% 4 | -0.85% 5 | 3.68% |
| 2004-4 | 0.53% 3 | 1.41% 4 | 0.06% 5 | -0.44% 1 | 0.23% 2 | -1.38% 3 | -0.76% 4 | -0.59% 5 | -0.95% |
| Avg | 0.59% | 0.17% | 0.60% | -0.14% | 0.87% | -0.45% | -0.03% | -0.24% | 1.37% |
| SPX summary for Presidential Year 4 1928 - 2004 | |||||||||
| Averages | -0.23% | 0.09% | 0.08% | -0.02% | 0.15% | -0.06% | -0.28% | 0.05% | -0.22% |
| % Winners | 50% | 50% | 50% | 55% | 65% | 60% | 50% | 40% | 55% |
| MDD 4/29/1936 8.89% -- 4/29/1932 7.02% -- 4/29/1960 3.14% | |||||||||
| SPX summary for all years 1928 - 2007 | |||||||||
| Averages | -0.01% | 0.08% | -0.18% | -0.24% | 0.07% | -0.13% | -0.07% | 0.31% | -0.18% |
| % Winners | 54% | 55% | 38% | 46% | 58% | 51% | 49% | 61% | 55% |
| MDD 4/29/1936 8.89% -- 4/28/1937 8.16% -- 4/29/1931 7.53% | |||||||||
Money supply (M2)

The money supply chart below was provided by Gordon Harms.
The recent strength in the market was probably caused by the dramatic increase in money supply.
Conclusion
The market is a bit overbought right now and volume on last weeks advance left a little to be desired, but, aside from volume, the breadth indicators look pretty good.
I expect the major indices to be lower on Friday April 25 than they were on Friday April 18.
This report is free to anyone who wants it, so please tell your friends. They can sign up at: http://alphaim.net/signup.html. If it is not for you, reply with REMOVE in the subject line.


