


The good news is:
• All of the major indices hit multi month highs last week.
Short Term
During the rally off the January lows new highs on the NYSE declined.
During last week's rally new highs on the NYSE also declined.
Prices declined sharply following the rally off the January lows.
The chart below covers the past year showing the S&P 500 (SPX) in red and a 10% trend (19 day EMA) of NYSE new highs in green. Dashed vertical lines have been drawn on the 1st trading day of each month; the vertical line is red on the 1st trading day of the year. I have drawn arrows pointing out the late January rally and the current period.

The next chart covers the same period showing an average of the Fidelity select funds in red and an indicator calculated by subtracting momentum of new lows from momentum of new highs of the select funds in blue. New highs and new lows of the funds have been calculated over the trailing 6 weeks.
The indicator fell just ahead of the mid October highs, and has been falling for the past week. It did not give a leading signal of the failed rally off the January lows.

Intermediate Term
You like to see volume increasing during a rally and that has not been happening.
The chart below covers the past 9 months showing the NASDAQ composite (OTC) in blue and a 5% trend (39 day EMA) of NASDAQ total volume in brown. Volume has been falling off since the March lows.

The next chart is similar to the one above except the index is the SPX and the indicator has been calculated from NYSE total volume.

Seasonality
Next week includes the 5 trading days prior to the 2nd Friday in May during the 4th year of the Presidential Cycle.
The tables show the daily return on a percentage basis for the 5 trading days prior to the 2nd Friday in May during the 4th year of the Presidential Cycle. OTC data covers the period from 1963 - 2007 and S&P 500 (SPX) data from 1953 - 2007. There are summaries for both the 4th year of the Presidential Cycle and all years combined. Prior to 1953 the market traded 6 days a week so that data has been ignored.
By all measures next week has been modestly negative although OTC data has been skewed by the 7.51% loss in 2000.
Report for the week before the 2nd Friday of May
The number following the year is the position in the presidential cycle.
Daily returns from Monday to 2nd Friday.
| OTC Presidential Year 4 | ||||||
| Year | Mon | Tue | Wed | Thur | Fri | Totals |
| 1964-4 | 0.85% | -0.36% | 0.59% | 0.25% | 0.18% | 1.51% |
| 1968-4 | 0.09% | 0.18% | 0.53% | 0.26% | -0.56% | 0.51% |
| 1972-4 | -0.63% | -2.21% | 0.79% | 0.93% | 1.16% | 0.05% |
| 1976-4 | 0.59% | 0.04% | 0.06% | -0.46% | -0.49% | -0.26% |
| 1980-4 | 0.56% | 0.84% | 0.95% | -0.22% | -0.14% | 1.99% |
| 1984-4 | 0.18% | 0.43% | 0.07% | 0.12% | -0.93% | -0.12% |
| Avg | 0.16% | -0.14% | 0.48% | 0.13% | -0.19% | 0.43% |
| 1988-4 | -0.83% | -0.22% | -1.65% | 0.27% | 0.61% | -1.83% |
| 1992-4 | 0.93% | 0.78% | 0.22% | -0.37% | -0.24% | 1.32% |
| 1996-4 | 0.14% | -0.30% | 0.06% | 0.37% | 1.26% | 1.53% |
| 2000-4 | -3.86% | -2.30% | -5.59% | 3.39% | 0.84% | -7.51% |
| 2004-4 | -1.14% | 1.86% | -0.30% | 0.02% | -1.13% | -0.69% |
| Avg | -0.95% | -0.04% | -1.45% | 0.74% | 0.27% | -1.43% |
| OTC summary for Presidential Year 4 1964 - 2004 | ||||||
| Avg | -0.28% | -0.11% | -0.39% | 0.42% | 0.05% | -0.32% |
| Win% | 64% | 55% | 73% | 73% | 45% | 55% |
| OTC summary for all years 1963 - 2007 | ||||||
| Avg | -0.11% | -0.12% | -0.01% | -0.04% | 0.09% | -0.19% |
| Win% | 51% | 49% | 53% | 60% | 60% | 53% |
| SPX Presidential Year 4 | ||||||
| Year | Mon | Tue | Wed | Thur | Fri | Totals |
| 1956-4 | -0.60% | -0.41% | -0.17% | -1.63% | -0.08% | -2.89% |
| 1960-4 | 0.09% | -0.69% | 0.28% | 0.51% | 0.82% | 1.01% |
| 1964-4 | 0.37% | 0.51% | 0.22% | 0.11% | -0.18% | 1.03% |
| 1968-4 | -0.31% | 0.56% | 0.01% | -0.53% | 0.11% | -0.16% |
| 1972-4 | -0.46% | -1.32% | 0.65% | 0.33% | 0.58% | -0.22% |
| 1976-4 | 1.20% | -0.15% | -0.17% | -0.59% | -0.80% | -0.52% |
| 1980-4 | 0.76% | -0.12% | 0.88% | -0.98% | -1.33% | -0.80% |
| 1984-4 | 0.23% | 0.66% | -0.26% | -0.07% | -0.94% | -0.38% |
| Avg | 0.28% | -0.07% | 0.22% | -0.37% | -0.48% | -0.42% |
| 1988-4 | -0.37% | 0.42% | -1.67% | 0.21% | 1.15% | -0.25% |
| 1992-4 | 1.06% | -0.02% | -0.01% | -0.23% | 0.05% | 0.86% |
| 1996-4 | -0.13% | -0.40% | 1.02% | 0.10% | 1.03% | 1.63% |
| 2000-4 | -0.59% | -0.85% | -2.05% | 1.79% | 0.94% | -0.77% |
| 2004-4 | -1.05% | 0.77% | 0.17% | -0.08% | -0.07% | -0.26% |
| Avg | -0.21% | -0.02% | -0.51% | 0.36% | 0.62% | 0.24% |
| SPX summary for Presidential Year 4 1956 - 2004 | ||||||
| Avg | 0.02% | -0.08% | -0.09% | -0.08% | 0.10% | -0.13% |
| Win% | 46% | 38% | 54% | 46% | 54% | 31% |
| SPX summary for all years 1953 - 2007 | ||||||
| Avg | -0.14% | -0.01% | -0.01% | -0.13% | 0.05% | -0.24% |
| Win% | 39% | 47% | 53% | 47% | 56% | 42% |
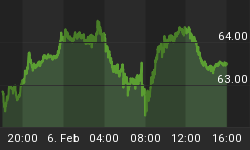
Money Supply (M2)
The money supply chart has been provided by Gordon Harms. Money supply has been falling sharply.

Conclusion
Over the past week breadth indicators deteriorated, money supply growth has been contracting and seasonally the coming week has a modestly negative bias.
I expect the major indices to be lower on Friday May 9 than they were on Friday May 2.
This report is free to anyone who wants it, so please tell your friends. They can sign up at: http://alphaim.net/signup.html. If it is not for you, reply with REMOVE in the subject line.


