


9/26/2008 7:32:15 AM
Markets are on shaky ground here - not good on a Friday.

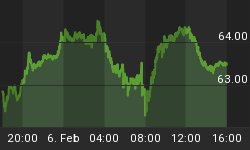
Stock Barometer Analysis
The barometer remains in Buy SUPPORT Mode.
The Stock Barometer is my proprietary market timing system. The direction, slope and level of the Stock Barometer determine our outlook. For example, if the barometer line is moving down, we are in Sell Mode. A Buy or Sell Signal is triggered when the indicator clearly changes direction.
Stock Barometer Cycle Time
Today is day 5 in our up cycle.
The Stock Barometer signals follow 5, 8, 13, 21 and sometimes 34 day Fibonacci cycles that balance with 'normal' market cycles. Knowing where you are in the current market cycle is important in deciding how long you expect to maintain a position.
Potential Cycle Reversal Dates
2008 Potential Reversal Dates: 12/31, 1/11, 2/1, 2/13, 3/6, 4/5, 4/22, 5/23, 6/6, 6/27, 7/13, 9/2, 10/3. We publish these dates up to 2 months in advance.
With 10/3 only a week away, evidence is suggesting the potential of a sharp move lower into next week.
My Additional timing work is based on numerous cycles and has resulted in the above potential reversal dates. These are not to be confused with the barometer signals or cycle times. However, due to their past accuracy I post the dates here.
2007 Potential Reversal Dates: 1/10, 1/14, 1/27, 1/31, 2/3, 2/17, 3/10, 3/24, 4/21, 5/6, 6/15, 8/29, 10/19, 11/29, 12/13, 12/23, 12/31, 1/11/08. 2006 potential reversal dates: 1/16, 1/30, 2/25, 3/19, 4/8, 5/8, 5/19, 6/6(20), 7/24, 8/20, 8/29, 9/15, 10/11, 11/28. 2005 Potential reversal dates based on 'other' cycle work were 12/27, 1/25, 2/16, 3/4, 3/14, 3/29, 4/5, 4/19, 5/2, 6/3, 6/10, 7/13, 7/28, 8/12, 8/30-31, 9/22, 10/4, 11/15, 11/20, 12/16.
The following work is based on my spread/momentum indicators for the QQQQ, GLD, USD, USO and TLT. They are tuned to deliver signals in line with the Stock Barometer and we use them only in determining our overall outlook for the market and for pinpointing market reversals. The level, direction, and position to the zero line are keys in these indicators. For example, direction determines mode and a buy signal 'above zero' is more bullish than a buy signal 'below zero'.
QQQQ Spread Indicator (NASDAQ:QQQQ)

The QQQQ Spread Indicator will yield its own buy and sell signals that may be different from the Stock Barometer. It's meant to give us an idea of the next turn in the market.
Gold Spread Indicator (AMEX:GLD)

To trade Gold, utilize the Gold ETF AMEX:GLD. This gives us a general gage to the overall health of the US Economy and the markets, as well as to assists us in the entry of positions in our stock trading service.
US Dollar Index Spread Indicator (INDEX:DXY)

To trade the US Dollar, I'd utilize the Power Shares AMEX:UUP: US Dollar Index Bullish Fund and AMEX:UDN: US Dollar Index Bearish Fund.
Bonds Spread Indicator (AMEX:TLT)

To trade Bonds, I recommend Lehman's 20 year ETF AMEX:TLT. Note that the direction of bonds can have an impact on the stock market. Normally, as bonds go down, stocks will go up and as bonds go up, stocks will go down.
OIL Spread Indicator (AMEX:USO)

To trade OIL, utilize AMEX:USO, the OIL ETF. We look at the price of oil as its level and direction can have an impact on the stock market.
Supporting Secondary Indicator

I monitor over a hundred technical indicators, some that are widely followed and some that are proprietary. These indicators break down the market internals, sentiment and money flow and give us unique insight into the market. I feature at least one here each day in support of our current outlook - and to give you an education on what professional traders utilize.
Summary of Daily Outlook
We remain in Buy Mode. We were looking for the markets to move higher into 10/3, but the way things are setting up, if we get a break of support, we're heading lower.
Yesterday the markets were considering the Plan as a done deal, today they're not. Whenever I see instability around a Friday, I get a little nervous. Throw in our key reversal date coming in next week, I think we have the potential for a snap move lower.
The other issue is complacency. We have an over complacent market. More call buying that put buying. Granted I'm part of that as I recommended 'CALLS' in the SOS options service. But next week, we'll likely be looking at PUTS.
If you have any questions or comments, email me at Jay@stockbarometer.com.
Regards,


