


11/3/2008 10:13:07 AM
Introduction
This week, we explore several topics of interest, including our regular review of marketplace events, The Japanese Yen carry trade, Supply and Demand, Metals Supply Chain, Inventories and their effect on Trade, our Market Outlook, and our Model Portfolio.
The week in Review - Events & Fundamentals:
Monday, October 27th:
There was a single economic report of interest released:
- New Home Sales (Sep) rose to 464K versus an expected 450K
This was an improvement over the August number, which was reported as 460K last month but revised downward to 452K on Monday. The pop in new home sales is welcomed by investors as builders continue to reduce bloated inventories, which fell from 11.4 months to a 10.4 month supply. Sales prices for new homes continue to drop even as inventory is worked off. All regions actually showed a decline in sales with the exception of the West, which increased some 18%. The West had seen the largest declines in both sales and price.
While there was mixed news on the earnings front, nine out of ten economic sectors fell, while telecom moved higher by 1.9%. This was due to Verizon meeting earnings expectations for the third quarter and growing subscribers faster than rival AT&T. AT&T had added 2M wireless subscribers due to the Apple iPhone. Verizon added 2.1M wireless subscribers and still managed to maintain margins. They also grew FiOS subscribers, which offset weakness in the traditional landline service.
The largest negative sentiment came from continued selling pressure in overseas markets, particularly the Asian markets. Hong Kong's Hang Seng fell 12.7% while intraday saw it off as much as 15.4%. It is down 65% for the year. Japan's Nikkei declined 6.4% to its lowest closing level since 1982 as traders worried that the strengthening yen will take a toll on Japanese exporters. The Eurostoxx 600 declined 1.9%, paring some losses in conjunction with a midday U.S. stock market recovery and word that ECB President Trichet said the ECB may cut rates again at its Nov. 6 meeting.
It appears that some of the forced selling across all markets is from traders unwinding the Yen carry trade. The Yen has been strengthening against all currencies, even the U.S. dollar as traders unwind the carry trade. A carry trade is one where traders borrow funds in low yielding currencies to provide capital for trades in higher yielding currencies. With the Yen at a 0.5% central bank rate, it was the most attractive target and a very crowded trade. With banks refusing to extend loans, traders are being forced to repay loans, which is resulting in a very strong Yen and causing panic selling to cover these loans.
In dollar terms, the Yen has risen 19% from 115 Yen oer dollar in November 2007 to below 93 Yen per dollar. Since August, the fall was from around 110 Yen per dollar to below 93 yen per dollar, a fall of 15.5% in two months. In other currencies, the climb has been much steeper since the dollar has been strengthening against all major currencies except the Yen. The unwinding of the carry trade appears to be a prominent factor in the forced selling pressures all markets have been under. In fact, the recent sharp rally in the yen prompted the G-7 to issue a statement warning about the "excessive gains" in the currency.
Tuesday, October 28th:
There was a single economic report of interest released:
- Consumer Confidence (Oct) fell to 38.0 versus an expected 52.0
September's Consumer Confidence number was revised to 61.4 from 59.8. October's number was the lowest on record, dating back to 1967. The combination of the equity market's decline on top of housing's fall and coming off of record high energy prices has left consumers shell-shocked.
The market rally was largely due to the absence of forced selling. The Yen carry trade appears to be back on as the Japanese central banks 0.5% interest rate is, once again, attracting traders to "cheap" money. This caused the Japanese Yen to weaken against the dollar and makes it attractive to take a new loan in Yen to invest in higher yielding markets. This was literally an overnight phenomenon. The effect of taking out the forced selling pressure that contributed so much to the markets downward trajectory has created just the opposite effect.
Wednesday, October 29th:
There was a single economic report of interest released:
- Durable Goods Orders (Sep) rose 0.8% versus an expected -1.0% decline
Most of the Durable Goods increase was due to a strengthening of transportation orders which translates primarily to aircraft. In addition, government spending supported the rise. Without defense spending and transportation, this represents a decline of investment of about -1.4%, not good news.
The focus was on the Fed policy announcement at 2:15pm. The Fed voted unanimously to decrease the Fed Funds rate target from 1.5% to 1%. They also reduced the Discount rate from 1.75% to 1.25%. Separately, the Fed established temporary currency swap lines with the central banks of Brazil, Mexico, South Korea and Singapore. This expands on the Fed's earlier swap arrangements with10 other central banks.
P&G, Kraft, and Kellogg exceed earnings and revenue expectations. Notice that all three companies produce food and household related products. They are the natural defensive stocks that will continue to do well on a relative basis in a slowing economy. Of course, the problem with looking at these stocks as investments is all the professional money managers already positioned into these stocks.
The market searched for a direction and it looked like a final hour rally was going to push the markets out of the initial resistance zone, when the final fifteen minutes saw huge selling pressure eliminating the day's gains for the major indexes. In fact, the DIAmonds and the SPYders actually ran up to the next resistance level where they reversed and the significant selling began. This was clearly a sell program being kicked off in the final minutes of trading. Apparently the SEC is concerned about market manipulation and has decided to investigate the activity.
Thursday, October 30th:
There were three economic reports of interest released:
-
Chain Deflator-Advanced (Q3) came in at 4.2% versus an expected 4.0% increase
-
GDP-Adv (Q3) fell -0.3% versus an expected -0.5% decline
-
Initial jobless claims for last week came in at 479K versus an expected 473K
The stronger than expected GDP number was welcomed by investors and was, in part, the cause of the higher open. The Chain-Deflator came in a bit higher than expected, and represents the Fed's favorite inflation gauge, and is also running hotter than expected. With the fall in the price of crude oil, this number is expected to drop significantly and seems to have been discounted by market participants. The continuing trend in a high number of initial jobless claims suggests that consumer spending will continue to erode, but was not that far from expectations and may be priced into the market.
Many Asian central banks cut rates following the Fed's rate cut on Wednesday. The Bank of Japan is widely expected to cut its rate from the current 0.5%, with a 64% chance of a quarter point rate cut. The market appears happy with the coordinated central bank efforts to contain the credit crisis by lowering the cost of credit.
San Francisco Fed President Janet Yellen stated the economy is likely to contract significantly in the fourth quarter. The statement occurred late in the session and was the cause of the swoon in the final hour of trading. The buying interest in the final fifteen minutes countered that swoon. Yellen was the first Fed member that has spoken publicly since Wednesday's rate cut.
Exxon Mobil (XOM) reported its fourth straight quarter of record earnings but is not expected to continue that streak with the drop in crude prices seen over the last three months. The price of the near term futures contract for a barrel of crude oil fell $1.56 to close at $65.96.
Friday, October 31st:
There were three economic reports of interest released:
-
Employment Cost Index (Q3) rose 0.7% as expected
-
Personal Income (Sep) rose 0.2% versus an expected rise of 0.1%
-
Personal Spending (Sep) fell -0.3% versus an expected decline of -0.2%
-
Chicago PMI (Oct) came in at 37.8 versus an expected 48.0
-
Michigan Consumer Sentiment (Oct) came in at 57.6 versus an expected 57.5
The only report showing a clear deviation from expectations was the Chicago PMI. Clearly, there is a contraction in the economy around Chicago that is significantly greater than expected. The other numbers were very close to expectations with income slightly higher than expected and spending slightly lower than expected. These reports came out an hour before the open, expect the last two which came out 15 minutes and a half hour after the open, respectively.
Financials led the market higher with the sector advancing 5.5%. Even though oil moved higher, the energy sector moved up just 0.6%. The tech sector moved higher by 0.1% and acted as a drag on equities overall.
Japan's central bank cut rates from 0.5% to 0.3% in a curious move. With the Japanese Yen climbing it has really hurt the export driven Japanese economy. With Japan's interest rates already near zero, however, the central bank had little leeway. Rate increases and cuts are generally done in quarter point increments. The strange 0.20% cut is probably the Japanese central bank's maneuvering to be able to make another rate cut without moving the interest rate to 0%. The reduction of the interest rate will likely reignite the Japanese Yen carry trade and cause the Japanese Yen to fall in value. This will diminish forced selling pressure for traders who were squeezed by the incredibly fast rise in the value of the Yen.
The Japanese Yen Carry Trade
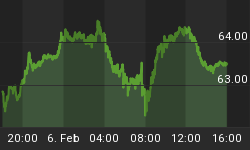
Following up from last week, we would be remiss not to update the situation from the past week. The Japanese Yen dropped from 110 Yen per dollar to 94.5 from the beginning of September until a week ago. In the last week the Yen weakened to around 98 to the dollar. That move up correlated with a cessation of the forced selling we have been observing in the markets.
Chart Yen Exchange Rate
The combination of a declining TED Spread indicating a thaw in credit markets with the weakening of the Yen meant that Japanese banks began to renew some of the Yen based loans and some traders decided to open new Yen based loans at the stronger Yen rate. With the Bank of Japan further lowering rates, there is less risk to being in the Yen carry trade, and this will translate to a drop in forced selling.
What we have seen lately with the TED Spread is that it closed this week at about the same level as a week earlier. It needs to continue to decline to indicate that credit will continue to ease. Without this or with a rising TED Spread, the banks will again refuse to extend loans and we will see forced selling begin to occur once again. It is important to monitor the Yen and the TED Spread regularly to determine how tight or loose credit is and whether the Yen trade will be maintained or will be forced to unwind.
Supply and Demand and the Ramification to Supply Chains
We are going to attempt to cover an important model in trade relating to commodities, pricing of related materials, and the effect on companies throughout the supply chain, with the effect on the economy in detail. We will review the metals supply chain, but this same model can be used for other commodities, such as plastics, chemicals, wood, and even foodstuffs, such as pork bellies or wheat.
Before we get into the subject of inventories and trade, let's step back a moment to define supply and demand and how prices are determined in a free market. Economics 101 teaches that when supply exceeds demand, prices will drop until supply comes into balance with demand. When supply is much lower than demand, prices will rise until supply meets demand. In a perfectly elastic market, these mechanisms work exceedingly well.
When there is excess supply, some producers will get out of the business if they have to reduce prices to sell their goods as the business is less profitable. This should result in a drop in supply. In addition, buyers may have a fixed budget to buy those goods and can now purchase more of each good raising the number of goods desired. At some point, price aligns supply and demand. The opposite case holds for excessive demand coming down when prices rise. Think about how you may drive your car less when fuel prices rise too much.
The Metals Supply Chain
When economies are expanding, there is great demand for steel and other metal products. In point of fact, steel is used in the construction of buildings, in bridges, in cars and trucks, in trains, and even some in planes. Steel is also used in building ships, a lot of steel. We see many things that require steel. We also see things like wire, which generally use a lot of copper. Aluminum and various alloys are used a lot in jet planes and for things where weight might be a concern. It is easy enough to understand that many things we use daily require metals to create them. That is on the demand side.
On the supply side, metals become available to use in manufacture of finished goods in a couple of different ways. First, they are mined and processed into raw metals or alloys. There are a large number of different alloys and grades of metal produced in all sorts of shapes and sizes. Another way to come up with finished metal supplies is to recycle scrap metal into metal stock.
Let's explore the mining to finished raw metal products process. To do mining requires long permitting and development process to bring a mining operation on line. Power must be brought to the processing site, roads must be constructed to the site, workers found locally or brought in, etc. Large vehicles are required to remove and move earth. Those vehicles require large amounts of fuel, along with tracks or very large and expensive tires. Suffice it to say that bringing a mine through approval to production after a site has been proven to be viable is generally a lengthy process taking years to decades. The mines have inventories of ore and metals that have been processed into raw metal.
Where mines are able to produce sufficient ore into metal, the steel, copper, aluminum, and other producers create sheet, plate, rod, bar, and other forms of stock metal to sell to manufacturers to create finished goods from. These producers of metal products create distribution networks that stock inventories of finished product they receive from the mills. The distributors supply the manufacturers of products that use the metal as part of their manufacturing process. This creates scrap metal, which is then sold to and collected by recyclers.
Recyclers collect scrap metal from the manufacturers to have that metal processed back into usable stock metal product that may again be offered to manufacturers for use to create finished goods. They have an inventory of scrap metal they have collected that they haven't actually taken to the scrap metal processors. There is actually a network of collectors who sell the scrap metal in bulk to large scale processing plants who turn the scrap into usable metal products. These scrap metal processors have their own inventories of scrap as well as finished goods they have processed.
Not all of the scrap is processed locally. Some may be sent in bulk to another location, often overseas. Where scrap is processed depends on supply and demand locally versus other locations. Demand for scrap varies, based on the availability of stock metal and the prices for that metal.
With all that as background, let's examine where things are today in the metals world.
-
The price of metals has dropped precipitously with other commodities.
-
Mines are continuing to produce ore and processed metals increasing supply of ore and raw metals.
-
Steel makers, and other finished goods metal processors have seen prices collapse, but so have some of their costs in terms of the energy costs required to produce finished metal products. Still, any raw metal that they recently purchased is likely to contribute to losses as they reduce production and grow inventories.
-
The drop in the price of steel and other metals has affected the prices of metal scrap.
-
The metal scrap processors can only get a price near the price of newly produced metal. With new metal flooding the market and the price dropping, metal scrap processors are closing their doors to receiving new inventories as they work off inventory that they paid a high price for before demand for their finished goods caused prices to crater, sometimes to prices below the price they paid for the scrap that they will use to turn into finished goods.
-
Processors scrap inventory will decline for a period of months as they work on turning the collected scrap into metal products.
-
Processors finished goods inventories may rise as they try to achieve top dollar for their finished products.
-
Collectors inventories will grow, subject to operating cash and space to store it.
We will circle back to the metals supply chain, but before we cover that, we will introduce one more dimension, global trade.
Global Shipping Rates
The Baltic Dry Index dropped around 30% last week. The Baltic Dry Index dates back to a coffee house in London in 1744. It reflects input from shipbrokers around the world to collect data on 26 routes to ship commodities, including coal, iron ore, grain, and others. We reference a chart from Wikipedia, below, that shows the four vessel types and both the percentage of vessels making up the dry bulk shippers as well as the percentage of tonnage carried over distance.

The chart shows that the largest vessels, the Capesize (note the chart erroneously refers to them as Capemax) carry the vast majority of tonnage over the longest routes, even though they have the smallest percentage of vessels in the fleet.
There are Capesize vessels that are actually dropping anchor rather than sailing at rates below their operating costs (estimated to be between USD 7-8K daily). Recent contracts to deliver cargo, known as fixings, have come out as low $9K daily on the spot market. A newly built Cape size vessel fixed a 12-month contract at USD 27K daily.
Let's take a look at the Index itself along with the price of gold as a reference:

We have data going back to January 2000, just before the bear market began when the tech bubble burst. You will note that the price of gold has risen pretty steadily since early 2001. What was the Fed doing during that time? The Fed was aggressively, albeit belatedly, lowering rates to try to counteract the falling stock market and correct for the recession the U.S. economy was in. That, of course, led to the overinflated prices for housing in the years where credit quality dropped along with rates and money was "cheap".
Shipping rates had moved lower before the recession was clearly understood, but accurately reflecting the diminished demand to ship commodities. By late 2001, shipping rates began to improve. But the economy was still in recession and the stock market continued to head lower for another year. What gives? Demand was increasing on a global basis for the commodities that were being shipped and the number of vessels that could ship the goods was inelastic. It takes about two years to complete a new ship and they are so expensive you don't tend to take them out of service except for maintenance or because they become too expensive to maintain, and then they are scrapped (now that's a lot of scrap metal).
Now let's take a look at the Index itself along with the price of crude oil as a reference:

You will note that there is little correlation of shipping rates and the price of crude oil. So why would we use the space to put the chart in front of your eyes? The operating costs of ships are based primarily on crew wages and bunker oil (the fuel that is used by the engines in these vessels). Of course there are port charges, and cargo loading and unloading charges, but these are generally included as part of the fixing of the amount to be charged to the shipper to transport the goods.
What does it mean when the price of crude oil drops from above $147 per barrel to less than half of that as it did over the last three months? The price of bunker oil fell from over $700 per metric ton in July to below $300 by the end of October. That means operating costs will have dropped dramatically unless the operators were hedged for bunker oil prices. Ships can hold months of supply of bunker oil so the effects of lower costs may only just be beginning to be felt.
There are rumors that some banks resumed lending in the past week to shippers. Letters of credit are required by ship owners to guarantee payment at journey's end. With credit frozen, shippers couldn't negotiate routes with ship owners, so supply of available vessels has been building. This has caused spot rates to enter a free fall as supply of vessels increases while contracts that can be awarded declines. With banks making loans, more contracts will be awarded, supply will diminish and rates may stabilize.
From a ship owners perspective, take a look at the numbers and timeframe. Rates had climbed from 2001 to 2008, a period of six and a half years. They climbed from around 850 to 11793 (nearly 1300 percent) in May 2008. They have fallen to 851 (93% decrease) since May, a period of only six months.
That is the effect of diminished demand but more acutely, the lack of available credit. With letters of credit, once again, beginning to be available, shippers can contract with ship owners to move goods and the Baltic Dry Index should begin to reflect this.
Anecdotal Evidence of the Metals Supply Chain
A conversation with a scrap metal collector (recycler) brought up some interesting information:
-
They had knowledge of ships turned around in mid-voyage. These ships were steaming toward China, already fully loaded with cargos of metal, mainly steel.
-
The ships were turned around by the buyers of the steel who indicated they would not accept delivery.
-
This has produced excess supply of steel in U.S. markets driving down U.S. steel prices.
-
Processors that take on scrap metal have closed their doors to taking on new scrap until they work through three months of inventory.
-
This collector (recycler) has enough space to store the scrap for up to two years, and is well capitalized. They can wait for the processor to re-open to take on new inventory.
-
There is less scrap to be picked up from manufacturers than has been the trend and business has slowed down.
It is all about inventories, more than the cost of production. With energy costs dropping, costs to process scrap are lower, but inventories are higher because metal stocks are higher due to the drop in global demand. All of this will have to be worked through before there is a healthy equilibrium between supply and demand.
Putting it all together
The chain of mining iron ore to produce iron pellets to produce steel and the parallel scrap processing process is complex. We note that inventories abound and commodities aren't being shipped overseas due to a lack of credit. As the credit markets thaw, then we will see trade occurring and these goods will, once again, begin to move around the world.
Demand for metals, both locally and globally will change but not all at once. There will be inventories of metals in various stages (from unprocessed, to semi-processed, to finished stock) to meet demand locally as well as suppliers overseas when credit markets allow ships to sail.
We will look to exploit market inefficiencies in the supply chain of metals (and other raw or processed goods) to determine where the best values are and target our stock purchases to take advantage of price inequities. In fact, we have already done this in our model portfolio with our purchase of Ship Finance (NYSE:SFL) and also with our purchase of Petroleo Brasileiro (NYSE:PBR). Even our attempted purchase of Landec Corp (NASDAQ:LNDC) is a focus on the food supply chain with LNDC positioned in processing, distribution, and packaging of foods.
Market Outlook
Let's take a look at liquidity. The TED Spread finished Friday at $2.65 which is two basis points lower than a week ago Friday. The TED spread needs to continue to move lower and the upcoming week must see it move lower or it suggests the credit the thawing process has come to a stand still.

Recall the TED Spread is the difference between the 3-month LIBOR rate and the 3-month T-Bill rate. The recent high was on Oct 10th at 4.64%. If the TED Spread continues to move down in an orderly manner and gets below 2.00 and hopefully down toward 1.00 or lower, the credit markets will have demonstrably thawed and the focus will turn from interbank liquidity to other economic concerns.
Oil closed the week with near term futures contracts at $67.81 per barrel. That is up modestly from a week ago at $64.15.
The forced selling pressure seems to have abated in conjunction with the fall in value of the Yen. While we could see a resurgence of forced selling, it has disappeared at the moment.
Let's take a look at the chart of SPYders (Amex:SPY) since they mimic the S&P-500.

This is the same chart we reviewed last week with last week's activity now represented. Everything that we suggested indicated the market was ready to move higher occurred. The bulls successfully defended support on Monday as the markets closed just above support. Tuesday saw a huge up day with a close above the initial resistance line (R1). Thursday saw a move above the 20-day moving average (the black dashed line). The SPYders hadn't closed above that line since late August. Finally, Friday saw price move above the second resistance line (R2) that had contained price with intraday price reaching it on Wednesday and Thursday. We are concerned with the volume decreasing as price is moving up. We would be concerned about a short term failure of the uptrend when price reaches the upper Bollinger Band (where the light blue area ends).
Let's take a look at the QQQQs next, as they are the ETF that mimics the NASDAQ-100.

The QQQQs (NASDAQ:QQQQ) clearly show a break of support which could have been quite nasty except that the SPYders bounced after testing support on Monday. The QQQQs and DIAmonds made the same move, so clearly the SPYders have been the pathfinder for the indexes. We believe this is because of the leadership of financials, since financials have led the markets down over the past year due to fears of a recession and the emergence of the credit crisis.
The rest of the chart suggests the QQQQs are following the SPYders but we note that the QQQQs haven't yet been able to retake R2, which suggests the relative weakness of the QQQQs in relationship to the SPYders. We believe that a rally will, in fact, be led by new leadership, but will have tech as a necessary component. Until the QQQQs assume a leadership position, we believe the markets won't see a significant rally.
Let's take a look at the DIAmonds (Amex:DIA) next, as they are the ETF that mimics the Dow Jones Industrial Average.

The DIAmonds mimic the SPYders but never had to fully retest support. When the SPYders were able to rally, the DIAmonds traded in lock step. The Dow 30 are actually leading the indexes higher and may be the first to lose the momentum as they are fast approaching a likely resistance area.
We would expect the DIAmonds to lose their upward momentum by mid-week, which will also be reflected in the SPYders and the QQQQs. We would urge caution as the DIAmonds approach the top of the Bollinger Bands, and take defensive action before the QQQQs and SPYders reach their upper Bollinger Bands if the DIAmonds reverse there.
Let week we asked the question, "Are we at a bottom?" We reiterated our call for the bottom but indicated we could not be sure. It was all about the SPYders retesting support and then bouncing. That occurred and our bottom call is still intact.
Next week, we believe that markets could stall and retrace a bit. At this time, we don't expect a full retracement back to the bottom, but we do expect a shallow retracement.
Conclusion
Last week we predicted a break-out move was coming within a week and it occurred on Tuesday followed by continuation. The fundamentals still argue that stocks could move higher. Realize, however, that even as companies are meeting earnings expectations, the vast majority are taking down their guidance. As earnings guidance is reduced, the value of a company's earning power is reduced and share prices fall. Since this week's rally has been a rising tide that lifted all boats, it may disguise the weakening of companies that have taken down their guidance.
We note that traders should ready themselves for a mid-week retracement and be prepared to add to long positions by the following week.
We hope you have enjoyed this weekly article. You may send comments to mark@stockbarometer.com. Please don't be shy in expressing your opinions of what you would like to see covered.


