


Summary of Index Daily Closings for Week Ending Mar 5, 2004
| Date | DJIA | Transports | S&P | NASDAQ | Jun 30 Yr Treas Bonds |
| Mar 1 | 10678.14 | 2916.61 | 1155.97 | 2057.80 | 112^12 |
| Mar 2 | 10591.48 | 2896.90 | 1149.10 | 2039.66 | 111^22 |
| Mar 3 | 10593.11 | 2887.96 | 1151.03 | 2033.36 | 111^17 |
| Mar 4 | 10588.00 | 2884.62 | 1154.87 | 2055.12 | 111^30 |
| Mar 5 | 10595.55 | 2893.07 | 1156.86 | 2047.63 | 114^07 |
| SHORT TERM FORECAST (Next Two Weeks) | ||||
| TREND | PROBABILITY | Legend | ||
| Substantial Rise | Low | |||
| Market Rise | Medium | Very High | 80% | |
| Sideways | Medium | High | 60% | |
| Market Decline | Medium | Medium | 40% | |
| Substantial Decline | Medium | Low | 20% | |
| Very Low Under | 20% | |||
| INTERMEDIATE TERM FORECAST (Next 12 Weeks) | ||||
| TREND | PROBABILITY | Substantial | 800 points+ (DJIA) | |
| Substantial Rise | Low | Market Move | 200 to 800 points (DJIA) | |
| Market Rise | Medium | Sideways | Up or Down 200 (DJIA) | |
| Sideways | Medium | |||
| Market Decline | High | |||
| Substantial Decline | High | |||
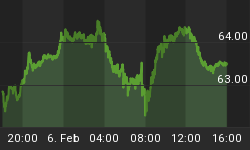
This week the Dow Jones Industrial Average was essentially flat, up 11.63 points, closing at 10,595.55. Last week's Short-term Technical Indicator Index reading of negative (31.00) pointed toward a small decline this week. It did hit an intraweek low Friday of 10,525, putting it down 70 points for the week until a late day rally reversed that. So, call this the first week out of the last eight that our Shortterm TII has not been accurate in forecasting the market's direction. Close, but no cigar, as they say. Malaise reigns, a standoff between the forces of inflation and deflation, between a deteriorating technical landscape and rising liquidity. The ten week cycle has been up for the past four weeks and crests next Friday, yet the market averages struggle to push higher. This is Bearish price action. The Dow Theory Industrials/Transports Bearish divergence remains intact, the Trannies a whopping 187 points (6.5 percent) from confirming. We await a Dow Theory sell signal where both averages break down to new lows. The Fibonacci time/price relationships pointing toward a top already being in place remains intact (see February 20th's newsletter in the archives at www.technicalindicatorindex.com).
| Equities Markets Technical Indicator Index (TII) ™ | ||||
| Week Ended | Short Term Index | Intermediate Term Index | ||
| Oct 31, 2003 | (21.38) | (55.42) | Scale | |
| Nov 7, 2003 | 0.50 | (53.47) | ||
| Nov 14, 2003 | (42.75) | (52.33) | (100) to +100 | |
| Nov 21, 2003 | 0.38 | (51.90) | ||
| Dec 5, 2003 | (31.75) | (55.18) | Negative (Bearish) | |
| Dec 12, 2003 | (5.83) | (54.43) | Positive (Bullish) | |
| Dec 19, 2003 | (6.50) | (47.03) | ||
| Jan 2, 2004 | (48.17) | (40.33) | ||
| Jan 9, 2004 | (96.50) | (39.28) | ||
| Jan 16, 2004 | (20.00) | (40.65) | ||
| Jan 23, 2004 | (8.13) | (32.15) | ||
| Jan 30, 2004 | 2.81 | (25.98) | ||
| Feb 6, 2004 | 11.75 | (20.19) | ||
| Feb 13, 2004 | (68.25) | (22.19) | ||
| Feb 20, 2004 | (30.00) | (22.36) | ||
| Feb 27, 2004 | (31.00) | (20.17) | ||
| Mar 5, 2004 | 16.00 | (17.17) | ||
This week the Short-term Technical Indicator Index comes in at positive 16.00, meaning we can expect the equity market to move up next week, but the move could be choppy. This indicator is a useful predictor of equity market moves over the next two weeks, both as to direction and to a lesser extent strength of move. For example, readings near zero indicate narrow sideways moves are probable. Readings closer to +/-100 indicate with a higher degree of confidence that an impulsive move up or down is likely over the short run.
The Intermediate-term Technical Indicator Index is useful for monitoring what's over the horizon- over the next twelve weeks. It serves as an early warning system for unforeseen trend changes of considerable magnitude. This week the Intermediate-term TII comes in at negative (17.17), warning that a significant reversal remains at risk over the next three months. Massive increases in M-3 could mitigate the damage or the timing, and in fact recent increases have reduced this indicator's negative readings.
The question on every Bear's mind is, when can we expect a significant downside trend change to occur? While not predictive, the following chart can offer us confirmation while identifying a high probability bifurcation point. By comparing the DJIA with its 50 Day Moving Average over the past three years, the chart shows that whenever the DJIA breaks decisively above/below its 50 Day Moving Average, that is, crosses over by at least 1.5% to 2.0%, the probability is high that a significant move in a new direction is underway. No guarantees, but highly probable. What happens is, the 50 Day MA switches from being support (a floor) to resistance (a ceiling) or vice versa once equity prices cross the line by 1.5% or more. Lesser magnitude crossovers are not reliable forecast indicators.
What's interesting is as of Friday's close, the Dow Industrials sit a mere 45 points from crossing below their 50 Day Moving Average. A break under 10,350 would confirm a new downtrend in the Blue Chips is underway.

The next two charts show that two major indexes have recently rallied to new all-time highs. For them, the Bull market did not end in 2000 as it did in the NASDAQ and S&P. It appears the Dow Industrials' Bull market ended in 2000, however if we reach new all-time highs over the next year, then this massive correction since 2000 would be just that. Which is not necessarily good news, for it would mean the Bear has yet to arrive in all its fury. If what we've just gone through is not the Bear Market, but simply a topping Bearish divergence among the major averages, heaven help us for what lies ahead.
The Amex Composite was developed with a base value of 550 in 1995. It includes all Amex listed companies, REITS, and closed end investment vehicles. Undoubtedly it has been a major beneficiary of massive liquidity pumping, especially what has flowed into real estate. The Russell 2000 measures the performance of the 2,000 smallest companies in the Russell 3000 index, representing about 7.5 percent of the total market capitalization of the U.S. equity market.
Note that even though both of these averages apparently are not experiencing the Bear market, they both now sit atop multi-year trend channels. It looks as if these averages are poised to join in the coming equity market decline. Should they head for the bottom of their respective trend channels, we're talking about corrections to the tune of 35 percent. In other words, the Bear may have arrived late for these two averages, but he may be about to arrive in spades.
Zoran Gayer writes a weekly Elliott Wave piece on www.safehaven.com and believes that the top of the bull market from the 1980s is ending now, instead of the year 2000. This may be the case.


The S&P 500 is nowhere near reaching its all-time highs, so it appears the Bear in this index did in fact begin in March 2000. What's particularly interesting is that around the equinox, for the past six years, there has been a significant bottom or top in the S&P 500 every single year. In fact tops and bottoms have alternated every other year. This year we are due for a top - and in fact price action has this average set up perfectly to top this month. I honestly don't know why trend changes are occurring every March, but they are.
On Friday, the S&P 500 hit a new rally high, intraday, hitting 1163.23. But this just gets the market to the 50 percent retracement point of the March 2000 to October 2002 decline. This new rally high was not confirmed by either the Dow Industrials, Dow Transports, nor the NASDAQ Composite, a major Bearish divergence. And that's the technical picture this week ... except for the mischief of M-3.
The Economy:
The news wasn't so terrific, again. Personal Spending rose in January according to the Commerce Department, up 0.4 percent. Yet personal income was up only 0.2 percent. The difference? Debt. Spending on Durable Goods was down 3.3 percent - that's a one month figure, not for a quarter or a year.
Construction Spending fell 0.3 percent in January, reports the Commerce Department. This was the first drop since last May. This drop occurred in the face of falling long-term interest rates. Discretionary construction project spending declined 6.6 percent in January - outlays for recreational facilities. Of course, federal government construction spending rose by a stratospheric 10.4 percent.
The Institute for Supply Management's Non-Manufacturing Index dropped sharply in February to 60.8 from 65.7 in January. This sector is responsible for eighty percent of GDP. Things appear to be slowing down.
Jobless Claims hit 345,000 for the week ended February 28th. Continued claims remained at 3.1 million out-of-work souls. There have been more jobs lost during this recession than in any other since World War II. We've lost at least 2.35 million payroll jobs in the past three years.
The Administration promised us that the "who cares" dividend tax exclusion and other tax cuts would create 320,000 new jobs each month in 2004. Well, we got the news Friday that the economy created a robust 21,000 net new Non-farm Payroll Jobs in February, a mere 299,000 off the mark. And January's reported job gain was revised down of course from 112,000 to 97,000 - a 13.3 percent correction lower. Hourly wages rose a miniscule 1.6 percent in the past year, the lowest since 1986. Gosh, we're not far from declining wages. The reported unemployment rate remained at 5.6 percent. But this figure has become essentially meaningless because of the machinations that water down its efficacy. Discouraged workers are excluded from the ranks of the unemployed, rendering this figure meaningless. The Labor Department reported Friday that 484,000 workers have given up looking for a job as they have concluded no satisfactory job is available.
Consumer Confidence fell again. The ABC News/Money magazine index fell to minus (-) 16 for the week ended February 29th. That's a 13 point decline since mid-January 2004. Not good.
An AOL internet poll showed John Kerry favored to beat G. Dubya by 52 to 48 percent. A Money/ICR poll showed the "investor class" favors Kerry. G. Dubya's respone? Boost M-3, Alan, ol'boy. Faster. Faster. Come on, crank those presses. By George, boost M-3 now!
Money Supply, The Dollar, & Gold:
The Federal Reserve finally came out with a statement about these mysterious M-3 revisions that took place the past two months. M-3 has been adjusted back to July 2003, and adoption of FASB Interpretation 46 has resulted in M-3 being lowered by roughly 100 billion. What's a few billion among friends, eh? Anyway, the numbers are comparative back to July we are assured and that's what matters most to me in analyzing the direction of the markets. Since the beginning of the year 2004, M- 3 is up 126.3 billion, and was up another 14.6 billion for the last week reported, February 23rd. Clearly the spigots are opened full throttle.
Why? The meteoric rise of the Money Supply tells us all we need to know about the most ominous threat to our economy as perceived by the Master Planners. Deflation. Deflation has scared the amalgams from their gnashing teeth. Why else would they allow nine percent annualized growth in M-3 only five months after an heroic 8.4 percent GDP quarter? How can the U.S. Dollar be rallying in the face of Banana-Republic-style monetization? Deflation. We must be at its precipice. Deflation means prices fall. Deflation means bubbles collapse. Deflation means debt overwhelms. Deflation means interest rates go even lower, earnings collapse, equities sell-off, and money becomes a scarce, yet coveted commodity.
The fix: create more money - enough to cover the expected demands of income-starved consumers - enough to reverse deflation's gravitational force. There can be no other strategy.
Will M-3 overproduction win out? Or will the black hole suck even hyperinflationary currency mass-production into its disintegrating clutches?
The Dollar will tell us. Watch the dollar. If it rises in the face of massive M-3 generation, deflation is winning. If it declines, deflation is harnessed. I'd feel a whole lot better right now if the Dollar was rising while M-3 grew modestly, perhaps 2 percent or so. But it is not happening this way. Nine percent annualized M-3 growth should cause the Dollar to plummet. Instead the dollar is up 3 bucks over the last three weeks.
Gold is currently viewed as a commodity and thus will act inversely to the dollar ... for a while. Then at some point look for a shift in view, Gold being perceived as a money substitute. At that point Gold rises (in deflation, cash is king). If inflation wins out, the dollar declines, Gold is once again viewed as a commodity and also rises. So in either scenario, over the long run, Gold rises.
Bonds and Interest rates:
Bonds launched higher this week as the case for deflation grows. As stated before, the Master Planners will not have it any other way for bonds. Long-term and short-term interest rates must stay low - at least until November. Period. Forget the technicals. This is a market that can be easily manipulated, er, ahem, managed.
Bottom Line:
There's a ton of liquidity pumping going on right now. Technicals are begging for a correction in equities, and soon and fairly steep. But M-3 is a governor, a brake, a safety net. Too much liquidity flows into all markets, even equities. Equities then take on the character of a commodity. Have you noticed silver? It's up 44 percent in five months. Oil? Up 24 percent. But this economy is slowing, failing to create enough jobs, failing to provide enough earnings opportunities. Low interest rates are killing fixed-income recipients, killing conservative investors, forcing investors to take on risk they normally wouldn't. The real estate bubble is placing home ownership further from the reach of lowincome individuals. The rich can wait this out. The middle class can't, and is borrowing to keep itself middle class, borrowing desperately so as not to fall to the clutches of a low-income lifestyle - and they are losing the battle, and they know it, which is why confidence indexes are plummeting. The poor get poorer. Meanwhile, back on the Texas ranch, the total capitalization of the equity market keeps pace with aggregate M-3. How long can this go on? At some point money pumping is seen for what it is - fake wealth. Inflation can quickly turn to deflation. We are seeing hints of that happening now. The proof is in the Bonds and in the Dollar. Both should be falling. Both are rising. Be very cautious.
"For My thoughts are not your thoughts,
Neither are your ways My ways," declares the Lord.
"For as the heavens are higher than the earth,
So are My ways higher than your ways,
And My thoughts than your thoughts."
Isaiah 55:8,9
| Key Economic Statistics | ||||||||
| Date | VIX | Mar. U.S. $ | Euro | CRB | Gold | Silver | Crude Oil | 1 Week Avg. M-3 |
| 10/03/03 | 19.71 | 93.53 | 115.40 | 242.55 | 369.4 | 4.83 | 30.10 | 8950.4 b |
| 10/10/03 | 18.51 | 91.79 | 117.85 | 246.75 | 374.1 | 4.90 | 31.99 | 8915.4 b |
| 10/17/03 | 17.62 | 92.61 | 116.33 | 242.00 | 372.2 | 4.94 | 30.70 | 8903.5 b |
| 10/24/03 | 17.70 | 91.46 | 118.04 | 249.50 | 389.2 | 5.16 | 30.16 | 8892.7 b |
| 10/31/03 | 16.00 | 92.98 | 115.57 | 247.00 | 384.6 | 5.06 | 29.11 | 8876.5 b |
| 11/07/03 | 16.84 | 93.20 | 115.11 | 249.75 | 383.4 | 5.05 | 30.85 | 8876.8 b |
| 11/14/03 | 17.33 | 91.58 | 117.60 | 256.25 | 398.0 | 5.41 | 32.37 | 8860.6 b |
| 11/21/03 | 18.98 | 90.72 | 119.09 | 250.50 | 396.0 | 5.29 | 31.61 | 8851.4 b |
| 11/28/03 | 16.32 | 90.28 | 119.65 | 253.25 | 398.0 | 5.39 | 29.96 | 8850.0 b |
| 12/05/03 | 17.23 | 89.17 | 121.60 | 256.00 | 407.3 | 5.49 | 30.73 | 8807.8 b |
| 12/12/03 | 16.46 | 88.44 | 122.74 | 261.75 | 410.1 | 5.64 | 33.04 | 8812.9 b |
| 12/19/03 | 15.71 | 88.53 | 123.58 | 259.50 | 409.9 | 5.72 | 33.02 | 8804.3 b |
| 1/02/04 | 18.30 | 86.93 | 125.76 | 256.75 | 416.1 | 5.96 | 32.52 | 8816.2 b |
| 1/09/04 | 16.79 | 85.40 | 128.19 | 266.50 | 426.8 | 6.49 | 34.31 | 8824.6 b |
| 1/16/04 | 14.98 | 88.05 | 123.57 | 265.50 | 407.0 | 6.33 | 34.00 | 8845.6 b |
| 1/23/04 | 14.88 | 88.81 | 125.81 | 266.50 | 408.0 | 6.36 | 34.94 | 8860.6 b |
| 1/30/04 | 16.46 | 87.48 | 124.42 | 262.10 | 402.9 | 6.25 | 33.05 | 8891.4 b |
| 2/06/04 | 16.00 | 86.15 | 126.83 | 260.50 | 403.6 | 6.27 | 32.43 | 8881.1 b |
| 2/13/04 | 15.62 | 85.68 | 127.25 | 264.85 | 410.8 | 6.58 | 34.56 | 8890.8 b |
| 2/20/04 | 16.05 | 87.40 | 126.96 | 264.50 | 397.5 | 6.53 | 34.25 | 8927.9 b |
| 2/27/04 | 14.53 | 87.89 | 124.52 | 273.90 | 396.8 | 6.71 | 36.16 | 8942.5 b |
| 3/05/04 | 14.52 | 88.75 | 123.28 | 274.00 | 401.6 | 6.99 | 37.26 | - |
Note: The VIX hit a new low. The CRB, Silver, and Crude all hit new highs.
The Passion of The Christ is now playing in your local theater
Go to www.thepassionofthechrist.com for more information


