


It appears that we are either just entering the consolidation phase of the US dollar index for the next 6 to 8 weeks or there is one final move to the upside before entering the consolidation phase. Every market around the globe is experiencing difficulty in one form or another which is associated with high debt levels. As much as other countries would like to totally switch out of US dollars to other currencies, this is about as realistic as the US and Canadian governments pulling oil out of gas stations and replacing it with natural gas...there are mechanisms in place that slowly can be dismantled but there is a lot of infrastructure changes involved, the markets having many internal layers of infrastructure. At some point in the future, the USD is going to get clipped, but as long as most debt still is in USD, this paper game will continue.
Currencies
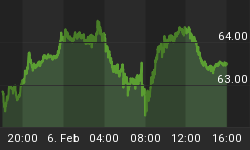
The daily chart of the Canadian dollar index is shown below, with lower Bollinger bands beneath the index in close proximity, suggestive that a bottom was put in place. Full stochastics 1, 2 and 3 are shown below in order of descent, with the %K above the %D in 1 and beneath the %D in 2 and 3. The %K in stochastic 2 curled up, suggestive that further upside is likely to extend for 7 to 10 trading days.
Figure 1
The daily chart of the Australian dollar index is shown below, with lower Bollinger bands in close proximity to each other beneath the index, suggestive that a bottom was put in place. Full stochastics 1, 2 and 3 are shown below in order of descent, with the %K above the %D in 1 and beneath the %D in 2. The %K in stochastic 2 appears to be hooking up, suggestive that further upside potential could extend 7-10 trading days out or longer.
Figure 2
The daily chart of the Euro index is shown below, which constitutes some 56.7% weighting (13.6% Yen, 11.9% Pound Sterling, 9.1% Canadian dollar, 4.2% Swedish Krona and 3.6% Swiss Franc). Since the Euro still is trying to find a bottom, further declines "on average" weigh in heavily that the USD will float higher. Full stochastics 1, 2 and 3 are shown below in order of descent, with the %K above the %Din 1 and beneath the %D in 2 and 3. Lower Bollinger bands are starting to decline beneath the index, but requires the Euro to continue going sideways for 5-7 trading days and form a base before there is any indication a bottom has been put in place. The Euro is fishing for a bottom and technically has yet to be confirmed.
Figure 3
US Dollar Index
The daily chart of the USD index is shown below, with upper Bollinger bands starting to rise above the index, suggestive a top was put in place. Full stochastics 1, 2 and 3 are shown below in order of descent, with the %K beneath the %D in 1 and above the %D in 2 and 3. Although yesterday saw a strong move down in the dollar, it still is not enough evidence to suggest that a top was put in place.
Figure 4
The weekly chart of the US dollar index is shown below, with upper 21 and 34 MA Bollinger bands in close proximity to the index, suggestive that further upside potential is probable. Full stochastics 1, 2 and 3 are shown below in order of descent, with the %K above the %D in 1 and 2 and beneath the %D in 3. Although the %K in stochastic 1 is toppy, the %K in stochastic 2 is still in its infancy with respect to a potential advancement. The USD is likely to consolidate over the next 6-8 weeks before breaking out, so keep this in mind with investments. The weekly chart for the USD remains bullish 4 to 6 months out.
Figure 5
The monthly chart of the US dollar index is shown below, with lower Bollinger bands starting to rise, suggestive that the low is in. Full stochastics 1, 2 and 3 are shown below in order of descent, with the %K beneath the %D in 1 and above the %D in 2 and 3. The %K in stochastic 2 appears to be curling up, suggestive that the upward trend in the USD remains intact.
Figure 6
The short-term Elliott Wave count of the USD index is shown below, with the preferred count shown in colour (path in green) and the alternate count shown in grey. Possibilities are that a running correction is forming, with wave C.(2) yet to form a sideways terminal impulse (ending diagonal, triangle, pennant). The alternate count suggests that the upward move will be corrective in nature with no impulsive nature..this would see a sharper decline in the USD than initially anticipated, but the upward trend would still be to the same target level of 89. Notice the expected time of the consolidation is expected to last until mid to late April before breaking out to the upside.
Figure 7
The mid-term Elliott Wave count of the USD index is shown below, with the preferred count displayed only. The count is the same, but the "bigger picture" is shown to display why the count is labeled as such.
Figure 8
That is all for this AM. A little bit more time was put into the construction of the alternate count as well as a retooling of the Degree of the count, so I will update tonight and tomorrow AM. Someone sent me an Elliott Wave related question a few weeks ago and I lost the email. If that individual could please send the question, I would be more than happy to answer it.
Based upon analysis, the USD has the potential to have further upside, so anyone playing the HDD, be careful...similarly for the HDU. Once the consolidation phase is over, the HDU will represent a good trade. Handle risk accordingly with tight stops because these ETF funds can move all over the place until a defined trend emerges.
Have a good day and back later on tonight.


