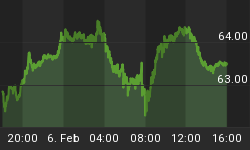
Price action during the past week makes it more and more likely that the anticipated 60-week cycle low has occurred and is beginning to exert upward pressure on prices. The recent low was the 61st week from the 120-week cycle low of March '03.
The stock market is a continuous interplay of short, intermediate and long term trends which are primarily the results of cycles of various periodicity. Good forecasting hinges on keeping these trends separate and not to be confused by them. This is why cycle analysis is of immeasurable value. Last week, we looked at an hourly chart which showed a number of short trend reversals making up a larger corrective pattern. These trends were caused by several cycles interacting with one another, and since the next short-term trading cycle low is only a few days away, the negative divergence showing on the RSI is a prelude to another short term pull back.
On the daily chart of the S&P below, note how the momentum indicators showed pronounced negative divergence at the top of the market just before the correction started, but today they give no such indication. However the stochastics, at the top of the chart, is overbought and the RSI at the bottom is beginning to lose its upside momentum. This confirms the hourly chart's reading that we are most likely at a short term top. But it also means that the pull-back will only be a consolidation of the recent gains and will not develop into severe weakness.

Dissecting the market:
Momentum has already been covered above. The short term momentum is waning, as is the longer term, but the intermediate term is building up again as a result of the 60-week cycle's recent low.
Structure: There is no reason at this time to change our thinking that we have begun wave 5 of the move which started in March '03.
Leading indicators: GE and the QQQ are pretty much in step with the market, and the Dow transport is leading the Industrials to the up side. The fact that the DJIA has not yet "confirmed" has nolong term significance. It does, however, add to the notion that a short term pull back is likely.
Volume: The volume has remained extremely light during the entire rise from the lows. This could be of concern if it starts to increase during the correction. But if it remains light, it simply means that the "big" money does not yet view this move as the beginning of anything substantial. Volume should pick up when we resume the up trend.
Breadth indicators: The McClellan oscillator continues to correct from an overbought condition and the new highs/new lows index is still acting well.
Summary: The market action continues to be positive. The 60-week cycle appears to have made its low, but a pull back into the lows of the short term trading cycle is expected. The Fibonacci sequence date mentioned earlier, could also be a factor in the consolidation process.
In spite of the recent strength, we have not yet quite confirmed the end of the larger corrective pattern.. We had some positive divergence at the lows and have overcome the down trend lines across the tops, but we still need to rise above the SPX 1150 level. When we do, new highs should follow very quickly.
What market are we talking about?
When we look at the long term charts of various indexes, it is clear that they show widely diverging pictures. The Nasdaq is still very close to its lows while the Russell 2000 is close to making new all-time highs. The bears are fond of using the term "secular bear market" which, according to them, began in early 2000 and which they expect to resume on its down path at any time. But they should be more specific as to which "market" they are talking about. The Russell 2000 is more likely to still be in a "secular bull market", and the Dow Industrials, which has already retraced far more than 50% of its decline and could soon make new highs, does not qualify either. In the end, they may be left with the NASDAQ as the only candidate that lives up to their expectations.
In fact, it is very likely that the real secular bear market has yet to start, and will probably not do so for another 3 or 4 years, just ahead of the lows of the 40-year cycle.
Gold: It is interesting that Richard Russell, who had been one of gold's strongest advocates appears to have had a 180 degree change of mind, and now sees the dollar beginning a new bull market.
As for gold, since the commercial traders have yet to reinstate their short positions in a significant way, it is likely that it is in no danger of extending its losses immediately.


