


Worries over the fragility of the economic recovery continues to haunt investors and dominate the new headlines. The latest headlines point to a widespread expectation of a double-dip recession by later this year. The latest round of worries are focused on potential European debt troubles, soft unemployment numbers and the latest round of U.S. economic numbers that proved to be disappointing to investors.
To give you an idea of the tone of last week's market, the word "fear" led the front page headlines of the Wall Street Journal at least twice last week. Last week saw asset prices across the board hit by panic surrounding Europe's sovereign debt crisis, among other concerns.
Acting against the market recently has been the seasonal tendency for volume to dry up as participation diminishes in the historically slow summer vacation period. A further impediment to the market's continued progress since last year's recovery began is the fact that this the "down" year in the alternate, or 2-year, cycle. And how can we forget that we're in the final years of the 40-year and 60-year cycles. As these cycles enter their respective "hard down" phases it tends to create a drag against the stock market when there isn't a strong counteracting force to create the necessary momentum for stocks, and to some extent commodities, to fight against the cyclical headwinds.
We experienced a strong counteracting force in 2009 with a combination of cyclical and monetary forces that were unleashed simultaneously. The bottoming of the Kress 6-year cycle in late 2008 followed by the peaking of the 10-year cycle in 2009 was partly responsible. Central bank and federal government intervention only added to the forward momentum and propelled stock and commodity prices to vertiginous heights relative to the credit crash lows. This confluence of forces unleashed the second most impressive recovery in over a generation as the S&P 500 Index rallied over 60% from March 2009 until May 2010.
The momentum, both externally and internally, has definitely slowed since this spring and the summer seasonal tendency of low volume has worked against the financial market in recent weeks. The resultant lack of buying pressure combined with negative internal momentum has been sufficient to send the market to lower levels. The downside internal momentum reflected in the NYSE internal momentum indicator series (HILMO) shown below, if it becomes established and if not reversed in the coming weeks, is apt to create a situation not unlike that of the summer of 2007. At that time the dominant long-term and intermediate-term internal momentum indicators established downtrends even as the S&P was making a new all-time high. This internally negative divergence set up the beginning of the last bear market. We'll therefore need to watch the important long-term and interim momentum indicators during the next market rally for signs of a reversal.

Ned Davis Research did a study which analyzed the combined decennial cycle and presidential cycle with the stock market's seasonal tendencies. The resulting pattern has so far described the year 2010 almost perfect. The low for the year was projected for late June/early July based on past decennial patterns and thus far the market has held true to this form. What's interesting is that this is the second year of presidential cycle, i.e. the second year of a new presidential administration. The first year of an incoming president tends to witness a stock market rally; the second year tends to be the "hangover" which often sees a wide trading range marked with exceptional volatility. As Ned Davis Research points out, starting around the commencement of the second half of the second presidential year is when the market tends to show strength after a major low has been made.
The year 1994 is a good analog to this decennial pattern. It was the second year of the previous Democratic presidential administration and it followed a stellar previous year for stocks in 1993. Note the trading pattern in the NASDAQ 100 Index (NDX) in '94 shown here.

The cyclical dynamics of 1994 were different than this year's cyclical pattern, however, as the 10-year cycle bottom of '94 was the major consideration that year. This year it's not as much the yearly cycle bottom as it is the residual effects of the credit crisis and the possibility that a European debt crisis may prove contagious to the continental, as well as the world, economy. The previous bear market in 2008 was fueled not only but financial "contagion" but also by fear itself, regardless of whether the fears were rational or irrational. Fear can be the market's best friend in a bull market, but in a bear market fear tends to feed on itself. That's why it will be of paramount importance to monitor how the market reacts to any increase in headline fear after the market's next technical rally. If internal momentum doesn't show any meaningful improvement this month even as the market moves higher, it could create a problem not unlike the August-September period of 1998, or even 2008, where fear feeds upon fear as the market grows internally weaker. This is what I mean by the "double-edged sword of financial fear." Of this I'll have more to say later.
Short-term, the indicators are lining up to suggest a market bottom is within reach. The OEX put/call ratio has reached one of those extremities normally only seen at market lows and implies the "smart money" option traders have been heavy buyers of OEX calls. The SPX price oscillators have also reached levels normally associated with market bottoms (see chart below) and the latest AAII investor sentiment poll showed a drop in the percentage of bulls to only 25 percent, a number not seen since early November 2009.

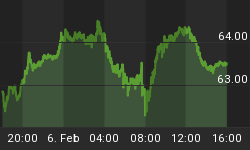
Price of Gold
Gold took a sharp hit last week and briefly violated its important 60-day moving average on an intraday basis on July 1. As you can see in the chart but was able to bounce back and close above the trend line to finish out the week on July 2.

A close under the 60-day MA would pave the way for the sellers to gain control, therefore it will be important to keep a weather eye on the gold price in relation to 60-day MA in the upcoming days as we watch for signs of stability and recovery following last week's sharp correction in the gold price.
Financial writer David Reilly of the Wall Street Journal wrote a sound commentary on the disconnect between gold and the dollar last week. In his article he outlined the reasons for the seemingly confusing disconnect between the two assets (confusing to some since inflation obviously isn't on the immediate horizon). As Reilly points out, both the dollar and gold have "become a bet against stability, amid uncertainty from Europe's sovereign-debt crisis, doubts on Asian growth and fears of a double-dip U.S. recession."
The article emphasized that Treasury investors would do well if deflation is imminent, as many analysts believe. On the other hand, gold investors stand to benefit from either the prospect of either deflation or heavy inflation. This is a point that, until recently, many investors had a difficult time grasping. My colleague Samuel "Bud" Kress of SineScope has for years pointed out that gold has its best performance during times of serious deflation since the yellow metal assumes its natural role as the investment vehicle of choice for capital preservation during financial market chaos and uncertainty. Paul Kasriel, chief economist at the Northern Trust Company of Chicago, also made this point years ago at the commencement of the gold bull market earlier this decade. He observed that when the Fed funds rate falls to 1%, gold always shines.
Along these lines Reilly concluded, "If, however, deflation did take hold, gold could yet prove itself as a crisis hedge against more upheaval in the global-banking system."
How to Trade the Most Profitable Chart Pattern
One of the most profitable chart patterns is also one that receives virtually no recognition from market technicians. The pattern I'm referring to is the "channel buster," which can be either a bullish or a bearish pattern depending on how it manifests in the charts of actively traded stocks and commodities. This highly profitable pattern was aptly named by stock market veteran Don Worden, editor of Worden's Weekly Reports. As its name implies, the channel buster involves a price breakout (or breakdown) either above or below the outer extremity of a trading channel.
The channel buster can be highly profitable if you know how to spot it. It's a chart pattern that is commonly seen in bull markets and bear markets alike and is the ultimate "all weather" money maker for short-term oriented traders. In my book, "Channel Buster" How to Trade the Most Profitable Chart Pattern," I explain the mechanics of this amazing chart pattern and how you can spot it an almost any actively traded stock or commodity. The book also provides rules for entering and exiting a trade based on the channel buster method. This is the only book available that deals exclusively with the channel buster. The channel buster is a breakthrough in the trend analysis of stocks and commodities.
The book was written so that retail traders might be able to understand and practically apply these useful methods of market analysis. The book is now available for sale at: http://www.clifdroke.com/books/channelbuster.mgi
Order today to receive your autographed copy and a FREE 1-month trial subscription to the Junior Mining Stock Report newsletter. Published each week, the JMSR newsletter uses the method described in this book for making profitable trades among the actively traded junior mining shares.


