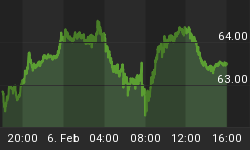
These past few days as the market indices broke through the head and shoulders neckline, I have had a barrage of emails asking if it was too late to buy inverse etf's after my original short sell recommendation on June 21st 2010.
My response to many readers is that if it is apparent to everyone to short that is the time to cover. It is dangerous to short when stocks are going into new lows as often time there are powerful dead cat bounces where covering takes place.
No one knows how to sell at the top or buy at the bottom. The only person who knows that is a liar. Often at tops every chart looks bullish, earnings are fantastic and every newsletter writer is bullish with new price objectives. Similarly at market bottoms charts look awful, stocks are experiencing losses and every newsletter writer is telling you to run for the hills. Be aware of the obvious because when it is evident to everyone that is when you have to be contrary to the market crowd.
Last week everyone was buying puts and shorting the market when it was an obvious head and shoulders pattern with a very bearish declining neckline. The slope of the neckline determines the bearishness of the pattern. It is important not to short when it is obvious and breaks the neckline. I look at key areas to short on counter rallies. Price volume action is very poor and I expect a few more days as it rallies to the resistance trendline and 50 day moving averages for additional short sale points.

The goal of a trader is to find key areas of support to buy when the stock is moving up and specific points of resistance to sell short. Markets don't top or bottom in a day. Often there are several signals to show that a market trend is changing. During those times there are often major counter trend rallies to shakeout the weak or inexperienced short traders who bought as the index dropped into new lows.
The cross of the 50 day and 200 day is called the cross of death for a reason quite often there is a major break to the downside over the next few weeks.
This past week as many analysts and publishers recommended to go short as the index broke the neckline of the head and shoulders pattern. I disagreed. I would definitely not recommend shorting into new lows but shorting at the end of a counter trend rally or where there is overhead supply where many investors want to get out.
If you are looking for possible points to go short stay tuned over the next few days as I will be sending out an alert to free subscribers.


