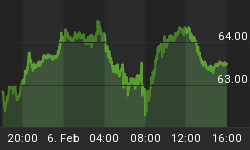
Price volume action is showing weakness on this rally and there is a good chance we could see a third failure at the 200 day. Many times, before bear markets ensue you can encounter three or four failed rallies above the 200 day before the primary bullish trend is reversed. Markets take time to transition from a bull to a bear market. Bullish mania wears down as repetitive failures shows a market that is losing confidence. On each subsequent rally the amount of bargain hunters dwindle. Price volume action is poor on this rally attempt. If we see another failure - which I believe may occur - we could see a major trend change.

Stochastics have been really accurate in this rangebound market. Oscillators are most valuable in trading markets, not trending. The S&P currently is a trading rangebound market while precious metals are in a steady upward moving trending market. Since May the SPY has been in a trading range that only would have been profitable if one used oscillators. On the other hand, in trending markets like gold which is in a steady uptrend the use of oscillators or stochastics should be secondary as those conditions shift as new high territory is reached. In trending markets it is more important to rely on moving averages and trend support to make buy or sell calls.
Be careful of selling gold or silver solely on overbought conditions. Gold (GLD) and Silver(SLV) are in very bullish patterns breaking out into new highs in an upward trending market. Whenever you see a breakout into new price territory on strong volume, momentum indicators need to be relied upon less. Gold and silver have both shown tremendous relative strength and I believe will provide continued safety during a market downturn.

I believe gold and silver will continue to perform strong compared to other assets. This summer has been hard on the equity markets and quantitative easing has been necessary for the Federal Reserve to maintaing momentum in this market. New job growth has been weak and we are not out of the woods with the European Sovereign Debt issue. Junior mining stocks who are translating cash into resources is where I want to be at the moment as they have held up well during this summer correction.
Gold is finding support at the 4 week moving average and is forming the handle on the cup. I believe gold and silver could have a very strong fall as the general public becomes aware of the junior mining sector and the value of gold and silver as an asset class.
Disclosure: Long Gold and Silver Mining Stocks


