


10/22/2010 8:55:16 AM
No reproduction, retransmission, or other use of the information or images is authorized. Legitimate news media may quote representative passages, in context and with full attribution, for the purpose of reporting on our opinions. Media interested in speaking to Mr. DeVincentis should email jay@stockbarometer.com to arrange a call.
There are no economic reports today, no speakers, meaning...
...That this should be a light volume day. It's not that often we get a clean day like this, the market is always on the look out for reports and when they come out and what the expectations are and how the market responds.
Unfortunately, that may take some of the volatility out of the day. And after yesterday's trade, that may make it a sleeper.
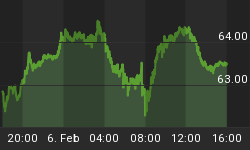
It's still all about the dollar and bonds. And if you were in our chat room, we discussed how the market was basically moving tick by tick inverse to the dollar. So what's happening in the dollar today? Well, overnight, the dollar moved back down to test support, then broke yesterday's highs, and now has pulled back. It's changing constantly, and you can see ES futures acting in response. I have these charts up live in our chat room, so you can see the same action.
Wild card? The wild card here are bonds. Bonds gave us a daily sell signal on Thursday and bonds can support stocks. They're moving back towards previous lows and if they break below that, then it can lift the stock market. However, I see this as more of a retest of lows and expect bonds and the dollar to strengthen. Both of which are negative for the stock market. The tug of war has been going on now for 2 weeks. It's made day trading very profitable, but position trading, much less so.
To help you navigate the intraday action, we have a chat room that I am in every day. We successfully migrated to PalTalk a lot faster than I expected. This will give you access to my trading screen during the day so we can go over recommendations in more detail. Here's the link to sign up:

Again, there are no reports today.
Here's the economic week ahead.

On to the charts:

Stock Barometer Analysis
We remain in Sell Mode, looking for the markets to move lower from now into 10/27.
The Stock Barometer is my proprietary market timing system. The direction, slope and level of the Stock Barometer determine our outlook. For example, if the barometer line is moving down, we are in Sell Mode. A Buy or Sell Signal is triggered when the indicator clearly changes direction. Trend and support can override the barometer signals.
Money Management & Stops
To trade this system, there are a few things you need to know and address to control your risk:
- This system targets intermediate term moves, of which even in the best years, there are usually only up to 7 profitable intermediate term moves. The rest of the year will be consolidating moves where this system will experience small losses and gains that offset each other.
- This system will usually result in losing trades more than 50% of the time, even in our best years. The key is being positioned properly for longer term moves when they come.
- Therefore it is vitally important that you apply some form of money management to protect your capital.
- Trading a leveraged index fund will result in more risk, since you cannot set stops and you cannot get out intraday.
Accordingly;
- Make sure you set your stops so that you can lose no more than 2% per trade (based on the QQQQ if you're trading leveraged funds and options with our trading service).
Potential Cycle Reversal Dates
2010 Potential Reversal Dates: 1/19, 1/28, 3/2, 3/23, 4/7, 5/30, 6/10, 6/28, 7/10, 8/13, 9/7, 10/2, 10/27, 11/21, 12/19. We publish dates up to 2 months in advance.
We are looking for a larger move lower into 10/27.
As we approach that date, things get even more concerning. If the markets hang up into next week, then we are looking at an even larger potential for downside action. That being said, we will have to recognize the strength and either step aside or position to try and grab some upside...
My Additional timing work is based on numerous cycles and has resulted in the above potential reversal dates. These are not to be confused with the barometer signals or cycle times. However, due to their past accuracy I post the dates here.
2009 Published Reversal Dates: 1/20, 2/11, 3/7, 3/15, 4/8, 4/16, 4/27, 5/7, 6/8, 7/2, 7/17, 9/14, 10/10, 10/24, 11/12, 11/30, 12/9, 12/21, 12/29. 2008 Potential Reversal Dates: 12/31, 1/11, 2/1, 2/13, 3/6, 4/5, 4/22, 5/23, 6/6, 6/27, 7/13, 9/2, 10/3, 10/22, 11/10, 12/11. 2007 Potential Reversal Dates: 1/10, 1/14, 1/27, 1/31, 2/3, 2/17, 3/10, 3/24, 4/21, 5/6, 6/15, 8/29, 10/19, 11/29, 12/13, 12/23, 12/31, 1/11/08. 2006 potential reversal dates: 1/16, 1/30, 2/25, 3/19, 4/8, 5/8, 5/19, 6/6(20), 7/24, 8/20, 8/29, 9/15, 10/11, 11/28. 2005 Potential reversal dates: 12/27, 1/25, 2/16, 3/4, 3/14, 3/29, 4/5, 4/19, 5/2, 6/3, 6/10, 7/13, 7/28, 8/12, 8/30-31, 9/22, 10/4, 11/15, 11/20, 12/16.
Spread Indicators
Use the following spread/momentum indicators to assist in your trading of the QQQQ, GLD, USD, USO and TLT. They are tuned to deliver signals in line with the Stock Barometer and we use them only in determining our overall outlook for the market and for pinpointing market reversals. The level, direction, and position to the zero line are keys in these indicators. For example, direction determines mode and a buy signal 'above zero' is more bullish than a buy signal 'below zero'.
QQQQ Spread Indicator (NASDAQ:QQQQ)

The QQQQ Spread Indicator will yield its own buy and sell signals that may be different from the Stock Barometer. It's meant to give us an idea of the next turn in the market.
Gold Spread Indicator (AMEX:GLD)

Want to trade Gold? Use our signals with the Gold ETF AMEX:GLD. Gold gives us a general gage to the overall health of the US Economy and the markets.
US Dollar Index Spread Indicator (INDEX:DXY)

Want to trade the US Dollar? Use our signals with the Power Shares AMEX:UUP: US Dollar Index Bullish Fund and AMEX:UDN: US Dollar Index Bearish Fund.
Bonds Spread Indicator (AMEX:TLT)

Want to trade Bonds? Use our signals with Lehman?s 20 year ETF AMEX:TLT. The direction of bonds has an impact on the stock market. Normally, as bonds go down, stocks will go up and as bonds go up, stocks will go down.
OIL Spread Indicator (AMEX:USO)

Want to trade OIL? Use our signals with AMEX:USO, the OIL ETF. We look at the price of oil as its level and direction has an impact on the stock market.
Supporting Secondary Indicator

We daily monitor hundreds of popular and proprietary technical indicators that break down market internals, sentiment and money flow to give us unique insight into the market. We feature at least one here each day in support of our current outlook. As an annual subscriber to any of our services, you will get access to all our charts and research.
Summary of Daily Outlook
We remain in Sell Mode, looking for a larger move lower into 10/27.
The market isn't breaking down, that supports the bullish case here. But it also can't hold on to gains, which supports the bearish case here. The market remains hypersensative to the dollar and less so Bonds. We'll be watching them closely for clues about the next larger move.
For my clients who trade intra day - here are the indices pivots for today's trade.

While we won't publish these every day, here's a look at a bunch of other indices...

I also publish chart of the ES and Qs with pivots in the chat room every morning. Join me in the chat room if you want to see how do I use them.
Here's a deeper look at the S&P Futures - these levels are very important if you're going to day trade the market.

These levels can be important for both day traders and investors. How? Well, if you are going to take a stock position, it's always best to get the most efficient entry. Understanding that there are key pivots during the day and key levels that futures traders look for, will help you figure a better entry price (instead of just buying at the open). Combine these levels with the timing of the economic reports on the list at the top of the page, and you can really catch some nice swings in the market. More efficient trade entry increases your relative profit per trade.
If you have any questions or comments, email me at Jay@stockbarometer.com.
Regards,


