


In latter August I penned a forecast for my subscribers to TMTF on Silver, and below is a brief excerpt from August 31st:
I believe Silver is about to stage a pretty large advance based loosely on the Elliott Wave pattern I see unfolding after a 9 odd month consolidation. (Obviously, there are also fundamental fiat currency/debt events worldwide that give it the underlying bull chart pattern). Since the average person can't run out and buy an ounce of Gold for $1,240 tomorrow, as the unfolding of the fiat crises continues to enter the public psyche, you will see a strong populace movement into buying silver, silver coins, etc. To wit, many silver stocks are moving up strongly of late, signally an imminent breakout of this precious and industrial metal.
The triangle pattern has taken nearly 9 months so far, and a move over $19.50 could start a multi-month run targeting $26-$29 per ounce for starters before a broad pullback.
I bring this up now, some 11 weeks later because Silver did in fact rally up from around $19 per ounce to $29 per ounce, and this was forecast well in advance using my crowd behavioral methodology and pattern recognition. The explosion in price I predicted happened much faster than even I expected, but does show the power of the crowds as they take hold of a new trend or a perceived trend and run with it. Part of the theory to be long silver also had to do with it being "poor man's Gold", which I indicated in my forecast. This is also crowd psychology in it's finest form. People perceive Gold to be "too expensive", but they can buy silver for only $29 an ounce. To wit, most investors do not really understand the difference between a stock that has 2 billion shares outstanding and one that has 20 million shares outstanding, they only care about price. They often think if a stock is $2 it's "cheaper" than the stock at $100, little do they realize that a $2 stock that goes to $1 is a 50% loss, but they perceive that as a small risk due to the price. With Silver, you have the mom and pops running out and buying it because it's "cheaper" than Gold.
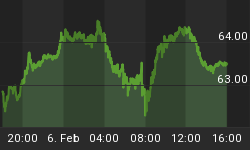
Now that Silver has run to $29, my target, and then dropped back, what should expect next? Well, we are in that "broad pullback" I mentioned back in late August that would occur once $29 was hit. Technically speaking and looking at typical crowd behavior, I am expecting consolidation to continue for awhile under $29 per ounce. I call this recent pattern an A B C rally, and once the C wave ends at $29 in this case, forecasting the next move is extremely difficult and can be exasperating. The C wave ran from $19 to $29, and at the tops of those moves everyone is bullish and breathless. Figuring out how the crowd behaves after those patterns is similar to pulling a rabbit out of a hat. With that said, I would expect a 38-50% retracement of the $10 move to about $24 an ounce worst case, and then we should re-attack the $29 highs and likely move into the $32-$34 per ounce range within the next 60 days or so. Silver will continue to out-perform Gold for the foreseeable future as well if I'm right. It appears by my chart below that we already had our initial corrective low, and now we will consolidate and break out.

Consider subscribing to our free reports today by going to www.MarketTrendForecast.com, and there you can take advantage of a one time coupon as well. I cover the SP 500, Gold, and Silver on a regular basis.


