


12/9/2010 9:05:08 AM
The bank indexes roared higher as they led financials which led the major indexes higher...
Recommendation:
Take no action.
Daily Trend Indications:

- Positions indicated as Green are Long positions and those indicated as Red are short positions.
- The State of the Market is used to determine how you should trade. A trending market can ignore support and resistance levels and maintain its direction longer than most traders think it will.
- The BIAS is used to determine how aggressive or defensive you should be with a position. If the BIAS is Bullish but the market is in a Trading state, you might enter a short trade to take advantage of a reversal off of resistance. The BIAS tells you to exit that trade on "weaker" signals than you might otherwise trade on as the market is predisposed to move in the direction of BIAS.
- At Risk is generally neutral represented by "-". When it is "Bullish" or "Bearish" it warns of a potential change in the BIAS.
- The Moving Averages are noted as they are important signposts used by the Chartists community in determining the relative health of the markets.
Current ETF positions are:
In cash.
Daily Trading Action
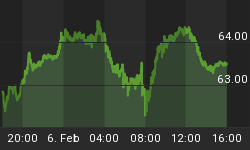
The major index ETFs opened higher and then flitted about resulting in a modest move higher after fifteen minutes then a dive lower for an hour. That would mark the intraday low as the major indexes spent the rest of the day making up lost ground in see-saw trading that eventually ended modestly higher than the open. All the major indexes remain in uptrend states. The Russell-2000 (IWM 76.53 -0.05) closed relatively flat as traders digested gains from the torrid uptrend it has been in. The Semiconductor Index (SOX 415.43 +3.92) posted a nearly one percent gain on the session. The Bank Index (KBE 24.44 +0.65) 3.79 +0.01) gained +2.7% and the Regional Bank Index (KRE 24.67 +0.50) posted a better than two percent gain. Both indexes closed above their 200-Day Moving Averages (DMAs) for the first time since early August. The 20+ Yr Bonds (TLT 93.26 -0.91) fell nearly one percent after recovering from a more than two percent collapse. NYSE volume was below average with 1.107B shares traded. NASDAQ volume was below average with 1.768B shares traded.
In addition to the weekly crude oil inventory report, there was a single economic report of interest released:
- MBA Mortgage Applications for last week declined -0.9%
The report was released at 7:00am EST.
The sell-off in precious metals continued as silver prices plummeted 5.1% to settle at $28.25 per ounce and gold dropped 1.9% to $1383.20 per ounce. In contrast, natural gas prices climbed 4.5% to $4.60 per MMBtu, a four-month closing high. Weekly natural gas inventory data are due tomorrow morning. We believe silver (in the form of the Silver ETF SLV) will pull back to its 20-DMA and then rebound. We are buyers of SLV at that level ($27.10 on Thursday).
The U.S. dollar closed essentially flat with Tuesday's closing value after opening higher and moving up to resistance in the morning session. The dollar has a profound effect on equities in an inverse manner. If the dollar is able to mount a rally and is joined by bond prices moving higher, equities will move lower, but that requires both the dollar and bond prices to move in the same direction.
Financials (+1.8%) led the major indexes higher and were joined by Tech (+0.9%), Consumer Staples (+0.3%), and Healthcare (+0.1%). Telecom was unchanged leaving five of the ten economic sectors in the S&P-500 moving lower with the slide led by Materials (-0.9%).
Implied volatility for the S&P-500 (VIX 17.74 -0.25) fell more than one percent and the implied volatility for the NASDAQ-100 (VXN 19.70 -0.46) fell more than two percent. This left the VIX at a new low not seen since prior to the beginning of the late April swoon that was the last significant collapse for the major indexes. The VXN hasn't yet reached a local closing low (18.67 achieved on Nov 5th) but it isn't that far off now. Complacency is now very high!
The yield for the 10-year note rose another seven and one half basis points to close at 3.24. The price of the near term futures contract for a barrel of crude oil fell forty-one cents to close at $88.28. The U.S. Government weekly crude oil inventory report showed a draw down of -3.82M barrels!
Market internals were mixed with decliners leading advancers 3:2 on the NYSE while advancers equaled decliners on the NASDAQ. Up volume led down volume by 3:2 or more on both the NYSE and the NASDAQ. The index put/call ratio fell -0.02 to close at 1.21. The equity put/call ratio rose 0.02 to close at 0.49. The level of complacency remains extreme.
Commentary:
Wednesday's trading saw a higher open price roll over into a quick swan dive and then the buyers stepped in at support. Thus far, the market is following the complacent route of recovering to move higher with implied volatility and put/call ratios dropping to extremely complacent levels. We believe that market participants are about to be rudely awakened but won't enter a short position until the market has signaled the uptrend is over. We will remain in cash for yet another day.
We hope you have enjoyed this edition of the McMillan portfolio. You may send comments to mark@stockbarometer.com.


