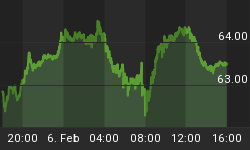
Stock markets are again heading north while market commentators question the health of the world economy and especially the situation in the U.S. But who is right and who is wrong? This very question prompted me to look at the ability of stock markets to anticipate the fortunes of the underlying economies.
In previous blogs I emphasized the importance of the U.S. stock market as a component of the ECRI Weekly Leading Index (WLI). For the purpose of this study, I have used the same algorithm previously used to track the WLI's Smoothed Annualized Growth Rate but changed it to a monthly basis instead of weekly. I call it a Monthly Smoothed Annualized Growth Rate or MSAGR for short.
In the graph below, I have depicted the MSAGR of the S&P 500 Index against the 12-month momentum of the USA Composite Coincident Indicator and it appears that the MSAGR of the S&P 500 leads the coincident indicator and therefore the U.S. economy by approximately four months.

Sources: I-Net; Plexus Asset Management.
What is remarkable is that in all instances when the MSAGR fell below zero, growth of the U.S. economy as measured by the coincident indicator declined approximately four months later, except in 1994 when the MSAGR only briefly turned negative.
As in 1994 the MSAGR briefly turned negative in August this year at -1.17% but bottomed and soon moved to positive territory again. The message I am getting is that the slowdown in growth of the U.S. economy in recent months is something of the past and that the first quarter of 2011 will show improvement. It is clear that those at the Fed are heavily influenced by the trend in the stock market and therefore felt strongly about implementing QE2 to prevent the ship from sinking.
Using the same algorithm, I calculated the MSAGR for the MSCI World Free Index in U.S. dollars and compared it to the 12-month momentum of the OECD Leading Indicator. While there is a close relationship between them, the MSAGR of the MSCI World Free Index is in fact more reliable than that of the OECD Leading Indicator. It was especially evident in 2002 when the OECD Leading Indicator's momentum turned positive while the MSAGR stayed in negative territory and therefore did not fall into the trap of the double-dip in global economic activity. In fact, since the start of this year the MSAGR of global stocks has led the OECD Leading Indicator's momentum.

Sources: I-Net; Plexus Asset Management.
What is going on in emerging markets?
My MSAGR of the MSCI Emerging Market Index in U.S. dollars had a solid uptrend that started when the Asian crisis ended at the end of 1998 but collapsed in 2008 with the Lehman saga.
The MSAGR of the MSCI Emerging Markets Index in U.S. dollars follows the same trend as that of the MSCI World Free Index in U.S. dollars. The growth is more elevated, though, and indicates the stronger growth in emerging economies compared to mature economies. It is interesting to note that unlike mature markets the MSAGR of emerging markets did not bottom in negative territory.

Sources: I-Net; Plexus Asset Management.
Looking at individual emerging economies and specifically my home country, South Africa, it is evident that the MSAGR of the South African stock market in local currency (rand) terms leads the economy as measured by the momentum of the SA Coincident Indicator by approximately four months. The MSAGR therefore points to the slowdown in growth of the SA economy bottoming in the final quarter of this year and activity strengthening in the first quarter of next year.

Sources: I-Net; Plexus Asset Management.
Bottom line: The stock market is probably right regarding an improved global economic outlook for the first quarter of next year. Sentiment can turn quickly, though. With a number of black swans on the radar I will watch the MSAGRs of the different markets very closely.
Did you enjoy this post? If so, click here to subscribe to updates to Investment Postcards from Cape Town by e-mail.


