


12/16/2010 8:57:12 AM
The Hindenburg Omen repeats itself after its appearance on Tuesday. They say third time is the charm...
Recommendation:
Take no action.
Daily Trend Indications:

- Positions indicated as Green are Long positions and those indicated as Red are short positions.
- The State of the Market is used to determine how you should trade. A trending market can ignore support and resistance levels and maintain its direction longer than most traders think it will.
- The BIAS is used to determine how aggressive or defensive you should be with a position. If the BIAS is Bullish but the market is in a Trading state, you might enter a short trade to take advantage of a reversal off of resistance. The BIAS tells you to exit that trade on "weaker" signals than you might otherwise trade on as the market is predisposed to move in the direction of BIAS.
- At Risk is generally neutral represented by "-". When it is "Bullish" or "Bearish" it warns of a potential change in the BIAS.
- The Moving Averages are noted as they are important signposts used by the Chartists community in determining the relative health of the markets.
Current ETF positions are:
In cash.
Daily Trading Action
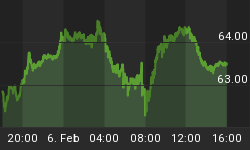
The major index ETFs opened lower and tested lower in the first half hour of trading. The bulls then moved into high gear driving the major indexes into positive territory with the major indexes climbing rapidly until some time after 10:30am to 11:00am, depending on the index you were monitoring. From that point, the major indexes began to weaken and continued to move lower until a buying surge began with an hour remaining in the session. A high-volume sell-off in the final fifteen minutes saw the major indexes close near their lows. Still, all the major indexes remain in uptrend states with a bullish BIAS. The Russell-2000 (IWM 77.07 -0.24) posted a fractional loss after it attempted to move more than 1.0% higher on the day. The Semiconductor Index (SOX 406.03 -4.64) posted a loss of more than one percent and closed not far above its 20-Day Moving Average (DMA). It is in a trading state. The Bank Index (KBE 24.54 -0.27) closed off more than one percent and is in a trading state while the Regional Bank Index (KRE 25.03 -0.15) posted a fractional loss. The 20+ Yr Bonds (TLT 90.94 -1.20) fell more than one percent. NYSE volume nearly double to 1.121B shares traded. NASDAQ volume was around average with 1.866B shares traded.
In addition to the weekly curde oil inventory report, there were eight economic reports of interest released:
- MBA Mortgage Applications for last week fell -2.3%
- CPI (Nov) rose +0.1% versus an expected +0.2%
- Core CPI (Nov) rose +0.1% as expected
- Empire Manufacturing Survey (Dec) rose +1.2% versus an expected +0.6%
- Net Long-term TIC Flows (Oct) came in at $27.6B
- Industrial Production (Nov) rose +0.4% versus an expected +0.3% rise
- Capacity Utilization (Nov) came in at 75.2% versus an expected 75.0%
- NAHB Housing Market Index (Dec) came in at 16 versus an expected 17
All the reports were released before the open with the exception of the last one, which came out a half hour after the open.
The Fed conducted in Permanent Market Operations (POMO) and after completing their buying yields began to rise, with a corresponding fall in bond prices. Many market participants are betting that the Fed's policy on quantitative easing will not be successful and with the Fed actively trying to reduce yields but with yields steadily climbing, it appears the Fed's policy is in jeapordy.
The U.S. dollar rallied +1.0% after gapping up and closing near its highs. Worries over European debt, after Ireland voted to accept the ECB/IMF bailout caused the Euro to sink further. In addition, the dollar strengthened versus the British pound and the Japanese Yen.
Implied volatility for the S&P-500 (VIX 17.94 +0.33) rose nearly two percent and the implied volatility for the NASDAQ-100 (VXN 18.86 +0.72) rose four percent.
The yield for the 10-year note rose seven basis points to close at 3.52. The price of the near term futures contract for a barrel of crude oil rose thirty-four cents to close at $88.62. The weekly U.S. government report showed crude oil inventories experienced a drawdown of -9.85M barrels!
Market internals were negative with decliners leading advancers 2:1 on the NYSE and by 3:2 on the NASDAQ. Down volume led up volume by nearly 3:1 on the NYSE and by more than 2:1 on the NASDAQ. The index put/call ratio fell -0.62 to close at 0.83. The equity put/call ratio rose 0.04 to close at 0.55. Once again, complacency is extremely high.
Wednesday's trading saw a back-to-back appearance of the Hindenburg Omen. The "Omen" made an appearance on Tuesday. We will need one more appearance by the end of the year or at least in early January to forecast a significant drop for the major indexes. At this time, we are on watch for such an appearance to confirm the Omen.
Wednesday's move lower was on an increase in volume. There is some cause to be concerned but the major indexes stubbornly refuse to exit their uptrend states so the momentum is still with the bulls here. Implied volatility continues to rise while the index put/call ratio saw insurance premiums redeemed with traders indicating complacency over potential downside here.
The Dow was able to maintain a level above support and even made a new intraday high before moving lower. We continue to monitor weakness in the semiconductor index as it approaches its 20-DMA. The attempt by the bulls to run the Russell-2000 higher after two days of weakness also failed. There are cracks in the façade but no indication yet of a significant break down for the major indexes. We remain in cash as we wait for confirmed topping action.
Commentary:
Wednesday's trading saw a back-to-back appearance of the Hindenburg Omen. The "Omen" made an appearance on Tuesday. We will need one more appearance by the end of the year or at least in early January to forecast a significant drop for the major indexes. At this time, we are on watch for such an appearance to confirm the Omen.
Wednesday's move lower was on an increase in volume. There is some cause to be concerned but the major indexes stubbornly refuse to exit their uptrend states so the momentum is still with the bulls here. Implied volatility continues to rise while the index put/call ratio saw insurance premiums redeemed with traders indicating complacency over potential downside here.
The Dow was able to maintain a level above support and even made a new intraday high before moving lower. We continue to monitor weakness in the semiconductor index as it approaches its 20-DMA. The attempt by the bulls to run the Russell-2000 higher after two days of weakness also failed. There are cracks in the façade but no indication yet of a significant break down for the major indexes. We remain in cash as we wait for confirmed topping action.
We hope you have enjoyed this edition of the McMillan portfolio. You may send comments to mark@stockbarometer.com.


