


1. Gold Spot Price Analysis
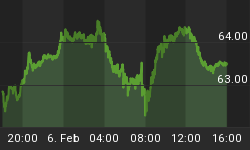
1.1. Gold in USD (one ounce = US$1,374.40)


-
As expected Gold did not manage to break out immediately above US$1,430.00. The correction during the last 10 days brought Gold even back to US$1,360.00 but the setback should be done for now. The Gold price is at the same level like two month ago therefore we are still in this sideways consolidation. The probability for a break out to the upside is much higher than for a correction.
-
The technical picture is kind of weakening. Many analysts have been pointing out to the divergences in MACD & RSI. And the last attacks towards new highs lack power and seemed to be kind of exhausted.
-
But until now the 50-dMA (US$1,369.39) has withstood every correction on a daily close basis (for silver it´s the 20dMA now at US$28.43). Therefore I think this rally is not yet over. As well we are still missing the final parabolic spike in gold that has been so typical in every up move since this whole bull market started in 2001. Only after that vertical craziness a nasty correction should follow (and so far this has always happened in spring and not earlier) that will bring prices back to long term moving averages like the 200-dMA or at least to the 150-dMA.
-
The Bollinger Bands (US$1,416.50 and US$1,350.28) are moving closer together and indicating that a bigger move is about to come.
-
The 200-dMA (US$1,232.06) is far away and will meet prices again after the big final of this up move - probably in spring 2011.
-
The short & medium picture is unchanged and still very bullish. My next price target is at least the Fibonacci - Extension (261,8% of the last big correction) at around US$1,600.00. This is very possible until spring 2011.
-
After a final parabolic excess up to US$ 1,600.00 or even US$2,000.00 I expect a longer period of correction and consolidation to follow in spring 2011.
-
The DowJones/Gold Ratio is at 8,36 points and is moving since august in a sideways range between 8,50 and 7,90.
-
Long term I expect the price of gold moving towards parity to the Dow Jones (=1:1). The next primary cyclical change is still years away. This means we are still in a long term bull market in gold (and also commodities) and in a secular bear market in stocks.
-
Last friday the biggest Gold-ETF, the SPDR Gold Trust, announced an increase of its gold holdings by 15.2 tons. That is the largest net influx since mid of October. On the 29th of June this year the ETF had reported record high holdings of 1,320.436 tons that until today have not been reached again. At that time gold was trading exactly at US$1,240.00.
| 06/29/2010: 1,320.43t | Gold closed at US$1,240.00 |
| 09/17/2010: 1,300.82t | Gold closed at US$1,273.77 |
| 10/14/2010: 1,304.34t | Gold closed at US$1,380.72 |
| 11/19/2010: 1,289.33t | Gold closed at US$1,353.13 |
| 12/16/2010: 1,283.76t | Gold closed at US$1,369.95 |
Looking at these numbers I can draw only one conclusion:
The up move in gold since August 2010 is not due to heavy buying in GLD and other ETF´s but due to heavy physical buying probably from asia. China & India are pushing the prices higher.....
http://www.spdrgoldshares.com
1.2. Gold in EUR (one ounce = 1.042€)


-
Gold in Euro consolidated during the last two weeks but could hold support around 1.030€.
-
A renewed test of the 50-dMA (1.005€) is possible but not necessary anymore since the overbought RSI has been neutralized. Only the sell signal in the PPO Indicator (=MACD) is giving some warning signals.
-
Looking at the weekly chart and especially the MACD Indicator (PPO) it is very obvious that €-Gold prices under 1.000€ now belong to the past and there is still a lot of upside potential for this move. I think at least 1.150€ is realistic until spring 2011. In the case that the euro crisis directly continues with bailouts of portugal and spain much higher prices are very likely.
1.3. Goldbugs Index USD (556.96 points)


-
The gold mining index HUI of course corrected as well during the last two weeks. The first attack towards 600 points failed miserably. On top a lower high has been established at 584 points. But the correction stopped at the lower trend line (550). Slightly below we can find the 50-dMA (541,69) as well as the lower Bollinger Band (534,43). Therefore this index now has strong support around 550-540 points.
-
For now the higher Bollinger Band (589,47) is limiting every bigger advance to the upside. Nevertheless I do think that a renewed attack towards the 600 level is very possible within the next 2-3 weeks.
-
Gold stocks are rising much faster than the general market.

Gold stocks are up nearly 35% this year while the broad market is up only 11%. And the divergence is getting bigger and bigger. As the gold price remains elevated, expect this trend to continue.
1.4. Gold COT Situation

- Despite price fluctuations of US$70 or 4.9% we can find only few changes in the COT report. The commercials do not increase their short positions anymore.
- The large speculative funds on the other hand reduced their net-Long-position down to a level last seen more than 4 weeks ago that proved to be a good bottom. This is very positive and supports a continuation of the ongoing rally.
04/18/2009 = -153,419 (PoG Low of the day = US$885)
12/01/2009 = -308,231 (PoG Low of the day = US$1,190)
05/11/2010 = -282,644 (PoG Low of the day = US$1,201)
06/15/2010 = -278,944 (PoG Low of the day = US$1,220)
06/29/2010 = -289,956 (PoG Low of the day = US$1,231)
07/13/2010 = -248,348 (PoG Low of the day = US$1,197)
07/27/2010 = -227,555 (PoG Low of the day = US$1,156)
08/10/2010 = -230,980 (PoG Low of the day = US$1,192)
08/24/2010 = -264,300 (PoG Low of the day = US$1,210)
09/07/2010 = -287,680 (PoG Low of the day = US$1,245 / High of the day = US$1,257)
09/14/2010 = -292,939 (PoG Low of the day = US$1,249 / High of the day = US$1,274)
09/21/2010 = -292,308 (PoG Low of the day = US$1,272 / High of the day = US$1,389)
09/28/2010 = -302,740 (PoG Low of the day = US$1,284 / High of the day = US$1,310)
10/05/2010 = -299,498 (PoG Low of the day = US$1.313 / High of the day = US$1,341)
10/12/2010 = -300,022 (PoG Low of the day = US$1,340 / High of the day = US$1,353)
10/19/2010 = -293,082 (PoG Low of the day = US$1,370 / High of the day = US$1,329)
10/26/2010 = -282,435 (PoG Low of the day = US$1,329 / High of the day = US$1,342)
11/02/2010 = -276,612 (PoG Low of the day = US$1,350 / High of the day = US$1,359)
11/09/2010 = -290,953 (PoG Low of the day = US$1,425 / High of the day = US$1,385)
11/16/2010 = -264,908 (PoG Low of the day = US$1,330 / High of the day = US$1,368)
11/23/2010 = -263,893 (PoG Low of the day = US$1,356 / High of the day = US$1,380)
12/07/2010 = -278,673 (PoG Low of the day = US$1,397 / High of the day = US$1,430)
12/14/2010 = -268,135 (PoG Low of the day = US$1,394 / High of the day = US$1,407)

1.5. Gold Seasonality
-
Gold continues to be in its strongest seasonal phase of the year.
-
In the last 10 years every up move that started in summer lasted at least until march. The only exception was 2009. At that time however gold was heavily overbought after a US$320.00$ move (+35%) within four months without any corrections.
-
During the christmas holidays precious metals often explode higher while most of the markets are closed and volume is very thin. This year we could see some surprises as well.
1.6. Gold Sentiment
-
Due to the renewed weakness in precious metals most of the analysts are now skeptic or even pessimistic. After two months sideways consolidation including high volatility we find a lot of helplessness within the market participants and many reports who are focusing on the technical divergences in MACD & RSI. Only if the majority of the market participants is on the wrong side or not positioned at all prices can go higher....
-
The Put/Call Ratio for gold futures is slightly up to 0.684 but still does not signal any medium-term top. Instead there is much more room left until this indicator gives us a sell signal.
1.7. Conclusion
-
Within the next two or three months Gold should be on the way to my next price target around US$1,600.00.
-
Gold is in a strong parabolic spike that could lead prices higher than many people can even imagine. Until end of the year Gold should reclaim the US$1,400.00 level again and continue to move towards US$1,440.00.
-
If instead and against my expectation the important support at US$1,360.00-1,355.00 does not hold the breakout will be postponed and we could see another successful test of US$1,320.00 - 1,330.00.
2. Recommendations
- Peter Schiff: Commodities, dollar, interest rates, chinese inflation, U.S. deficits http://www.youtube.com/watch?v=9nHQVIYBPdw&feature=sub
- Video: Jim Rogers, CEO Rogers Holdings http://blogs.reuters.com/chrystia-freeland/2010/12/07/video-jim-rogers-ceo-rogers-holdings/
- Report: Swiss Bank Refuses to Release Gold http://www.moneynews.com/StreetTalk/Swiss-Bank-Refuses-Release/2010/12/07/id/379238
- Mike Malloney: Dead Cat Bounce http://goldsilver.com/video/mike-maloney-dead-cat-bounce/?utm_medium=email
- GOLD CRAZY: New wave of Chinese money is set to slam the gold market http://www.thedailycrux.com/content/6373/Gold
- Gold and You: Topping Out or Topping Up? http://www.safehaven.com/article/19327/graceland-updates-4am-7am
Should you not be able to open the links directly, please copy the link into your internet browser.
You can subscribe to my free bi-weekly gold newsletter here: www.goldnewsletter.de
You can now buy my new record in iTunes Store. http://itunes.apple.com/de/album/knowthyself/id398849507


