


No reproduction, retransmission, or other use of the information or images is authorized. Legitimate news media may quote representative passages, in context and with full attribution, for the purpose of reporting on our opinions. Media interested in speaking to Mr. DeVincentis should email jay@stockbarometer.com to arrange a call.
12/28/2010 9:08:50 AM
The markets shrugged off China's second rate increase...
And the markets recovered during the day. Here's what we see.
Yes, the markets are at nosebleed levels here, but that doesn't mean they can't go higher. And what I said yesterday, the key is how the market closes. And it closed up.
Price action rules everything. And as much as I want the market volatility to come back (so I can get back to day trading) it's not here. My strategy is to trade stocks during periods of low volatility. When volatility returns, I'll migrate myself back into day trading.
So while volume remains light, we're at year end and this week in between Xmas and NYE can be very difficult to trade. One of the things I've observed over the years is that moves in penny stocks get magnified during this period. This can be a good time to turn pennies into real dollars! Click here for a penny stock service.
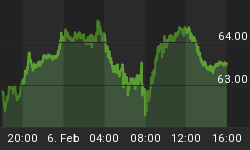
Here's a look at the global markets:

Here's the week ahead: (It is a light week)

To help you navigate the intraday action, we have a LIVE chat room that I am in every day. We run it on PalTalk. This will allow you to hear me, and chat with others. Upgrading will also give you access to my trading screen during the day so we can go over recommendations in more detail. Here's the link to sign up:

On to the charts:

Stock Barometer Analysis
We remain in Buy Mode, looking for the markets to move higher into the new year.
We are also in CAUTION mode - meaning the barometer has turned lower, but price action hasn't confirmed. That just means tighten stops, be cautious, etc., as the market can continue higher here - but we are seeing potential for a reversal.
The Stock Barometer is my proprietary market timing system. The direction, slope and level of the Stock Barometer determine our outlook. For example, if the barometer line is moving down, we are in Sell Mode. A Buy or Sell Signal is triggered when the indicator clearly changes direction. Trend and support can override the barometer signals.
Money Management & Stops
To trade this system, there are a few things you need to know and address to control your risk:
- This system targets intermediate term moves, of which even in the best years, there are usually only up to 7 profitable intermediate term moves. The rest of the year will be consolidating moves where this system will experience small losses and gains that offset each other.
- This system will usually result in losing trades more than 50% of the time, even in our best years. The key is being positioned properly for longer term moves when they come.
- Therefore it is vitally important that you apply some form of money management to protect your capital.
- Trading a leveraged index fund will result in more risk, since you cannot set stops and you cannot get out intraday.
Accordingly;
- Make sure you set your stops so that you can lose no more than 2% per trade (based on the QQQQ if you're trading leveraged funds and options with our trading service).
Potential Cycle Reversal Dates
2010 Potential Reversal Dates: 1/19, 1/28, 3/2, 3/23, 4/7, 5/30, 6/10, 6/28, 7/10, 8/13, 9/7, 10/2, 10/27, 11/21, 12/19. We publish dates up to 2 months in advance.
Our next date for 2011 is January 15th.
I have learned never to underestimate the potential of a year end advance. Price action trumps everything. Do I think that the market can continue higher into the 15th? Unlikely, but until we see selling, we cannot discount it.
My Additional timing work is based on numerous cycles and has resulted in the above potential reversal dates. These are not to be confused with the barometer signals or cycle times. However, due to their past accuracy I post the dates here.
2009 Published Reversal Dates: 1/20, 2/11, 3/7, 3/15, 4/8, 4/16, 4/27, 5/7, 6/8, 7/2, 7/17, 9/14, 10/10, 10/24, 11/12, 11/30, 12/9, 12/21, 12/29. 2008 Potential Reversal Dates: 12/31, 1/11, 2/1, 2/13, 3/6, 4/5, 4/22, 5/23, 6/6, 6/27, 7/13, 9/2, 10/3, 10/22, 11/10, 12/11. 2007 Potential Reversal Dates: 1/10, 1/14, 1/27, 1/31, 2/3, 2/17, 3/10, 3/24, 4/21, 5/6, 6/15, 8/29, 10/19, 11/29, 12/13, 12/23, 12/31, 1/11/08. 2006 potential reversal dates: 1/16, 1/30, 2/25, 3/19, 4/8, 5/8, 5/19, 6/6(20), 7/24, 8/20, 8/29, 9/15, 10/11, 11/28. 2005 Potential reversal dates: 12/27, 1/25, 2/16, 3/4, 3/14, 3/29, 4/5, 4/19, 5/2, 6/3, 6/10, 7/13, 7/28, 8/12, 8/30-31, 9/22, 10/4, 11/15, 11/20, 12/16.
Spread Indicators
Use the following spread/momentum indicators to assist in your trading of the QQQQ, GLD, USD, USO and TLT. They are tuned to deliver signals in line with the Stock Barometer and we use them only in determining our overall outlook for the market and for pinpointing market reversals. The level, direction, and position to the zero line are keys in these indicators. For example, direction determines mode and a buy signal 'above zero' is more bullish than a buy signal 'below zero'.
QQQQ Spread Indicator (NASDAQ:QQQQ)

The QQQQ Spread Indicator will yield its own buy and sell signals that may be different from the Stock Barometer. It's meant to give us an idea of the next turn in the market.
Gold Spread Indicator (AMEX:GLD)

Want to trade Gold? Use our signals with the Gold ETF AMEX:GLD. Gold gives us a general gage to the overall health of the US Economy and the markets.
US Dollar Index Spread Indicator (INDEX:DXY)

Want to trade the US Dollar? Use our signals with the Power Shares AMEX:UUP: US Dollar Index Bullish Fund and AMEX:UDN: US Dollar Index Bearish Fund.
Bonds Spread Indicator (AMEX:TLT)

Want to trade Bonds? Use our signals with Lehman?s 20 year ETF AMEX:TLT. The direction of bonds has an impact on the stock market. Normally, as bonds go down, stocks will go up and as bonds go up, stocks will go down.
OIL Spread Indicator (AMEX:USO)

Want to trade OIL? Use our signals with AMEX:USO, the OIL ETF. We look at the price of oil as its level and direction has an impact on the stock market.
Supporting Secondary Indicator

We daily monitor hundreds of popular and proprietary technical indicators that break down market internals, sentiment and money flow to give us unique insight into the market. We feature at least one here each day in support of our current outlook. As an annual subscriber to any of our services, you will get access to all our charts and research.
Summary of Daily Outlook
We remain in Buy Mode, looking for the markets to move higher into the end of December - but CAUTIOUS of a potential reversal here.
IF the markets do turn lower, we expect them to do so for the first two weeks of January.
Here's an important observation on gold:

If you're interested in attending a presentation of my Stock Trading Secrets Session, it will be held on Saturday January 8th, 2011 from 10am to 2pm. This is an online class designed for beginner to intermediate traders. I've had people take it multiple times because the theme changes along with the current market conditions. We will be holding these sessions on a monthly basis. Here's the link to sign up: (It's only $39.95 - and would make a great holiday gift too.) click here to sign up now
For my clients who trade intra day - here are the indices pivots for today's trade.

I publish charts of the ES and Qs with pivots in the chat room every morning. Join me in the chat room if you want to see them, and learn how to use them.

Here's a deeper look at the S&P Futures - these levels are very important if you're going to day trade the market.

These levels are important for both day traders and investors. How? Well, if you are going to take a stock position, it's always best to get the most efficient entry. Understanding that there are key pivots during the day and key levels that futures traders look for, will help you figure a better entry price (instead of just buying at the open). Combine these levels with the timing of the economic reports on the list at the top of the page, and you can really catch some nice swings in the market. More efficient trade entry increases your relative profit per trade.

This chart of the Qs says it all...
If you have any questions or comments, email me at Jay@stockbarometer.com.
Regards,


