


No reproduction, retransmission, or other use of the information or images is authorized. Legitimate news media may quote representative passages, in context and with full attribution, for the purpose of reporting on our opinions. Media interested in speaking to Mr. DeVincentis should email jay@stockbarometer.com to arrange a call.
1/14/2011 10:03:30 AM
We've been long and loving it, but we're cautious...
And many are cautious here. I'll show you how below. But that caution can create bullishness...
Sorry for the late report this morning. I have been digging away at my indicators all morning - trying to decipher this market. While it's been a month and a half that we've been long, it takes a lot of work every day to decipher the daily action.
And while I'd love to be going short here, the stocks I own are just doing too well. So I find it hard to make a huge bet against the market here. Yet...
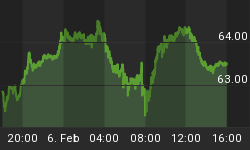
Here's a look at the global markets: We look at this to see how the day is setting up.

Here's the week ahead: We look at this for significant economic events that may trigger a reversal in the stock market.
Needless to say, it is Friday. If the markets rally today, we should have an up Monday as well and that would have me shorting the market early next week.

On to the charts:

Stock Barometer Analysis
The barometer remains in Buy Mode.
I do believe we are approaching a top this week - probably around Friday or Monday.
One of the reason I waited this morning was to see how the economic reports come out. It's all about how the bond and dollar acts.
The Stock Barometer is my proprietary market timing system. The direction, slope and level of the Stock Barometer determine our outlook. For example, if the barometer line is moving down, we are in Sell Mode. A Buy or Sell Signal is triggered when the indicator clearly changes direction. Trend and support can override the barometer signals.
Money Management & Stops
To trade this system, there are a few things you need to know and address to control your risk:
- This system targets intermediate term moves, of which even in the best years, there are usually only up to 7 profitable intermediate term moves. The rest of the year will be consolidating moves where this system will experience small losses and gains that offset each other.
- This system will usually result in losing trades more than 50% of the time, even in our best years. The key is being positioned properly for longer term moves when they come.
- Therefore it is vitally important that you apply some form of money management to protect your capital.
- Trading a leveraged index fund will result in more risk, since you cannot set stops and you cannot get out intraday.
Accordingly;
- Make sure you set your stops so that you can lose no more than 2% per trade (based on the QQQQ if you're trading leveraged funds and options with our trading service).
Potential Cycle Reversal Dates
2011 Potential Reversal Dates: 1/15, 1/29, 2/16. We publish dates up to 2 months in advance.
Our next date for 2011 is January 15th. We expect the markets to surprise everyone and continue higher into 1/15. So far this outlook is coming true. If you think about it, we've been long since the beginning of December. So if you read my stuff, we're been saying the same thing for about a month and a half. I never complain when we're making money - but the real money is made at the reversal. So when we've been right, and you've made some money, I'd start thinking about protecting those gains.
My Additional timing work is based on numerous cycles and has resulted in the above potential reversal dates. These are not to be confused with the barometer signals or cycle times. However, due to their past accuracy I post the dates here.
2010 Potential Reversal Dates: 1/19, 1/28, 3/2, 3/23, 4/7, 5/30, 6/10, 6/28, 7/10, 8/13, 9/7, 10/2, 10/27, 11/21, 12/19. We publish dates up to 2 months in advance. 2009 Published Reversal Dates: 1/20, 2/11, 3/7, 3/15, 4/8, 4/16, 4/27, 5/7, 6/8, 7/2, 7/17, 9/14, 10/10, 10/24, 11/12, 11/30, 12/9, 12/21, 12/29. 2008 Potential Reversal Dates: 12/31, 1/11, 2/1, 2/13, 3/6, 4/5, 4/22, 5/23, 6/6, 6/27, 7/13, 9/2, 10/3, 10/22, 11/10, 12/11. 2007 Potential Reversal Dates: 1/10, 1/14, 1/27, 1/31, 2/3, 2/17, 3/10, 3/24, 4/21, 5/6, 6/15, 8/29, 10/19, 11/29, 12/13, 12/23, 12/31, 1/11/08. 2006 potential reversal dates: 1/16, 1/30, 2/25, 3/19, 4/8, 5/8, 5/19, 6/6(20), 7/24, 8/20, 8/29, 9/15, 10/11, 11/28. 2005 Potential reversal dates: 12/27, 1/25, 2/16, 3/4, 3/14, 3/29, 4/5, 4/19, 5/2, 6/3, 6/10, 7/13, 7/28, 8/12, 8/30-31, 9/22, 10/4, 11/15, 11/20, 12/16.
Timing Indicators
Use the following Timing/momentum indicators to assist in your trading of the QQQQ, GLD, USD, USO and TLT. They are tuned to deliver signals in line with the Stock Barometer and we use them only in determining our overall outlook for the market and for pinpointing market reversals. The level, direction, and position to the zero line are keys in these indicators. For example, direction determines mode and a buy signal 'above zero' is more bullish than a buy signal 'below zero'.
QQQQ Timing Indicator (NASDAQ:QQQQ)

The QQQQ Spread Indicator will yield its own buy and sell signals that may be different from the Stock Barometer. It's meant to give us an idea of the next turn in the market.
Gold Timing Indicator (AMEX:GLD)

Want to trade Gold? Use our signals with the Gold ETF AMEX:GLD. Gold gives us a general gage to the overall health of the US Economy and the markets.
US Dollar Index Timing Indicator (INDEX:DXY)

Want to trade the US Dollar? Use our signals with the Power Shares AMEX:UUP: US Dollar Index Bullish Fund and AMEX:UDN: US Dollar Index Bearish Fund.
Bonds Timing Indicator (AMEX:TLT)

Want to trade Bonds? Use our signals with Lehman?s 20 year ETF AMEX:TLT. The direction of bonds has an impact on the stock market. Normally, as bonds go down, stocks will go up and as bonds go up, stocks will go down.
OIL Timing Indicator (AMEX:USO)

Want to trade OIL? Use our signals with AMEX:USO, the OIL ETF. We look at the price of oil as its level and direction has an impact on the stock market.
Secondary Stock Market Timing Indicator

We daily monitor hundreds of popular and proprietary technical indicators that break down market internals, sentiment and money flow to give us unique insight into the market. We feature at least one here each day in support of our current outlook. As an annual subscriber to any of our services, you will get access to all our charts and research.
Daily Stock Market Outlook
We remain in Buy Mode, looking for the markets to move higher into mid January. (And we are there). I have been expecting a top today or next Monday. We'll see how it plays out. Where would the energy come from? Look at the below:

Someone thought it would be a good idea to buy a whole bunch of QQQQ Puts. This can act as energy in the market - pushing us up higher and longer than people expect...
Or... If we do get a sell off, it may be shorter than we think - everyone is looking for the market to make a huge move lower. My expectations are tempered for the move lower.
Our next key reversal date is January 29th. So beware of a brief sell off here that gets the bears all excited - and a final thrust higher into the end of January.
The morning's action is very important, so if things change, I'll update things intra day. Be careful, everyone wants to grab the top here, which makes it more likely that we're not at 'the' top...
Trust me, I've been doing this for over a decade, writing the exact same article, looking at the exact same charts - nothing is new - and whatever you expect - is the least likely thing to happen. Solution? Stop expecting things to happen and start trading based on what is happening.
If you have any questions or comments, email me at Jay@stockbarometer.com.
Regards,
"Over 1540 Clients in 40 countries!"
click here to see our next trading class, blogs, videos, social media pages, etc....


