


7/14/2011 9:00:56 AM
Fed Chairman Bernanke allows for more quantitative easing...
Recommendation:
It appears that the top may be in for TLT and a corresponding bottom for TBT. We will abandon our long position in TBT if TLT hits $97.81. We expect a significantly lower open for TLT.
Click here to access our stock market chat rooms today! For a limited time, try our chat room for free. No subscription necessary to give it a try.
Stock Market Trends:

- ETF Positions indicated as Green are Long ETF positions and those indicated as Red are short positions.
- The State of the stock market is used to determine how you should trade. A trending market can ignore support and resistance levels and maintain its direction longer than most traders think it will.
- The BIAS is used to determine how aggressive or defensive you should be with an ETF position. If the BIAS is Bullish but the stock market is in a Trading state, you might enter a short trade to take advantage of a reversal off of resistance. The BIAS tells you to exit that ETF trade on "weaker" signals than you might otherwise trade on as the stock market is predisposed to move in the direction of BIAS.
- At Risk is generally neutral represented by "-". When it is "Bullish" or "Bearish" it warns of a potential change in the BIAS.
- The Moving Averages are noted as they are important signposts used by the Chartists community in determining the relative health of the markets.
Best ETFs to buy now (current positions):
Long DIA at $125.90
Long SPY at $134.43
Long QQQ at $58.20
Click here to learn more about my services and for our ETF Trend Trading.
Value Portfolio:
We are long TBT at $32.50 from June 16th. (TBT closed at $32.12 on July 12th)
We sold short one contract TLT July $98 Calls at $1.19 per share on June 16th
We sold short one contract TLT Aug $98 Calls at $1.80 per share on June 16th
We sold short one contract TLT Sep $98 Calls at $2.13 per share on June 16th
(TLT closed at $97.40 so the contracts we sold are sixty cents out of the money but with implied volatility still considerably lower than when we sold the options. Time value on all option contracts we sold continues to erode which means we can buy them back for less than we sold them for or, if price stays below $98.00, let them expire worthless and keep all the money).
Daily Trading Action
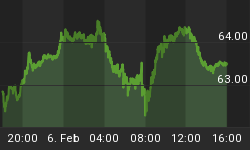
The major index ETFs opened higher and then attempted to move slightly higher in the first fifteen minutes before plunging in the next fifteen minutes. All that changed, however, when Fed Chairman Ben Bernanke released his prepared remarks at 10:00am and the major indexes headed higher in a powerful move that would last into late morning. Sideways trading then dominated through the end of the lunch hour when the bottom fell out. The sell-off erased gains of more than one percent for each of the major indexes with a rally in the final fifteen minutes helping to ensure that all of them were at least able to post fractional gains, but all of them closed lower than their higher opens. All the indexes we regularly report on are in trading states. The Semiconductor Index (SOX 393.87 -1.09) logged a quarter of one percent loss. The Russell-2000 (IWM 83.59 +0.74) posted a gain of nearly one percent Like the three major indexes, it has a BULLISH BIAS. The Regional Bank Index (KRE 25.61 +0.22) gained nearly one percent to close above all the Day Moving Averages (DMAs) we regularly report on and has a BULLISH BIAS. The Bank Index (KBE 23.35 +0.06) added a modest gain as did the Finance Sector ETF (XLF 14.99 +0.01). Long term bonds (TLT 97.40 +0.27) added a fractional gain but still appears to be topping here. TLT is above all moving averages we regularly report on but the BIAS of longer term bonds remains neutral and is in a trading state. NYSE trading volume decreased to below average 884M shares traded. NASDAQ share volume decreased to below average with 1.770B shares traded. The increase in volume is expected during option expirations week.
In addition of the weekly crude oil inventory report, there were four economic reports of interest released:
- MBA Mortgage Index for last week eased -5.1%
- Export Prices ex-agriculture (Jun) were flat
- Import Prices ex-oil (Jun) fell -0.1%
- Treasury Budget (Jun) came in at -$43.1B versus an expected -$45.0B
With the exception of the Treasury Budget which was released at 2:00pm, the reports were released an hour or more before the open.
The important events that occurred on Wednesday included China's GDP report of +9.5% growth which was higher than expected. That allowed U.S. markets to open higher. The dollar also fell as the Euro strengthened due to Italy's likely adoption of stronger austerity measures by Friday.
The big mover of equities was semi-annual monetary policy testimony Fed Chairman provides to Congress. When his prepared remarks were released while he was reading them, equities took off higher when he indicated the Fed was prepared to take further action if conditions warranted it. Wednesday he was before the House Financial Services Committee. Thursday he should repeat his performance in from the Senate's corresponding committee.
The U.S. dollar fell a bit more than one percent as the dollar's safe haven status was called into question with a lack of progress on the U.S. debt ceiling. We had predicted a move lower which helped U.S. equities to rally.
The yield for the 10-year note fell one basis point to close at 2.90. The price of the near term futures contract for a barrel of oil gained sixty-two cents to close at $98.05. The U.S. government's weekly report on crude oil inventories showed a draw down of -3.124M barrels.
Implied volatility for the S&P-500 (VIX 19.91 +0.04) was flat and the implied volatility for the NASDAQ-100 (VXN 21.82 -0.11) one half of one percent. We believe that a reduction in implied volatility is likely to occur in the short term.
Materials (+0.8%) and Energy (+0.7%) led a rally of seven out of ten economic sectors in the S&P-500. Consumer Staples were unchanged as Telecom (-0.2%) and Utilities (-0.2%) moved lower. The "risk on" switch was flipped to the on position on Wednesday.
Market internals were positive with advancers leading decliners 7:3 on both the NYSE and the NASDAQ. Up volume led down volume 2:1 on both the NYSE and the NASDAQ. The index put/call ratio fell -0.11 to close at 1.34. The equity put/call ratio fell -0.04 to close at 0.66.
Commentary:
Wednesday saw a higher open and then some profit taking at the open which turned into a significant rally on Bernanke's testimony. Those gains largely evaporated as many market participants took the opportunity to lock in gains or to reduce their holdings. We are still looking for a move higher by equities with a potential top having been put in the U.S. dollar and longer term bonds, This is options expiration week and we are still looking for equity prices to hold up into the end of the week.
We remain concerned that the top for equities may already be in. With that said, a significant amount of further quantitative will have a positive effect on equity prices but should have a negative effect on the value of the U.S. dollar versus other currencies. There is an overhang, as well, for U.S. treasuries from resolution of the debt ceiling. Interest rates required to successfully auction of U.S. debt will likely begin to creep up. In particular the credit rating of U.S. debt is, once again, up for review due to the lack of progress on the debt ceiling.
Stay tuned as we continue to monitor developments this week. We could exit our long equity index positions as early as Friday, depending on market action.
We hope you have enjoyed this edition of the McMillan portfolio. You may send comments to mark@stockbarometer.com.


