


With an apparent acceleration of the debt crisis in Europe and a prolonged budget fight set to continue in the United States, we have bear market drivers in place from a fundamental perspective. On Monday, two-year Greek debt exceeded a yield of 50% for the first time; the yield on 10-year Italian bonds rose another 27 basis points. Angela Merkel's party lost weekend elections in Germany, which brings into question public support for more bailouts in Europe.
On August 11, we noted the present day parallels to 2000 and 2008 should not be ignored. As outlined in the video below, the following markets/sectors still have long-term bearish signals in force from a technical perspective:
- S&P 500 (SPY)
- Small Caps (IWM)
- Emerging Markets (EEM)
- Dividend Stocks (DVY)
- Transportation Index (IYT)
- Basic Materials (IYM)
The yield on Greek and Italian bonds, coupled with weak long-term technicals, tell us the odds of a prolonged bear market have increased significantly in the last five weeks. If the bears are in control, how far could stocks fall from present levels? A lot further.
In October 2000, investors were still clinging to the idea of a new economy led by the unlimited potential of the internet. Valuations for tech stocks were driven to never-seen-before levels in March 2000. If someone pulled you aside in October 2000 and said, "Stocks will drop 46% from current levels," most investors would have probably laughed.

In January 2008, many investors still believed housing prices were going to the moon and if the economy ran into any trouble, the Fed would ride to the rescue. If someone in an elevator mentioned that stocks were going to fall another 52%, many would have considered calling for medical assistance.

No one was laughing as the S&P 500 Index lost an additional 46% from October 2000 to October 2002. Bear markets can inflict greater than expected damage to an investment portfolio.

No one was questioning bearish forecasts in March 2009 after the S&P 500 dropped another 52% from the levels seen in January 2008.

The video below outlines numerous similarities to past transitions from a bull market to a bear market. If stocks dropped 46% from a similar point in 2000 and fell an additional 52% after a similar point in 2008, it is in the realm of bear market reason that we could see similar outcomes in the months/years ahead. If stocks dropped between 46% (as they did in 2000) and 52% (as they did in 2008), we could see further declines of 49% (see chart below). A 49% drop from the S&P 500's recent close of 1,174 would bring the index down to 599.

Video contains updated charts & commentary as of September 5, 2011
How do we use this information? Is it time to panic? No, it is not time to panic, but it is a good time to put detailed defensive contingency plans in place to protect your net worth. We exited all of our core stock positions a few weeks back. Stocks could recover and make higher highs, but the odds of lower lows are greater. We head into the week with a sizable cash position, bonds (TLT), gold mining stocks (GDX), and an inverse S&P 500 Index exchange traded fund (SH). Gold mining stocks could perform well even if stocks can regain traction; they represent somewhat of an inflationary hedge to our deflationary and bearish positions (TLT and SH). Bear markets can be very volatile; inexperienced investors should tread very carefully, especially with inverse or short positions.
Many hard-working people cannot follow the markets on a daily basis. Since we all tend to make better decisions when we have more information, it might be nice to forward a link to this article to a friend, family member, or co-worker. At a minimum, it is helpful to be aware conditions currently exist that are similar to 2000 and 2008.
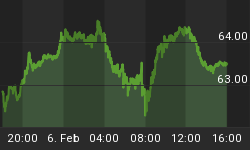
If Friday's breakout in gold mining stocks cannot hold, meaning GDX (below) closes below 64.19, we believe it is a deflationary signal and a negative for stocks (SPY), silver (SLV), and gold (GLD). A failed GDX breakout would put more pressure on silver and stocks in the short-term, but eventually the fear of deflation may get to gold as well. If the GDX breakout holds, it increases the odds gold and silver will at least hold up for a while longer, if not see significant gains.


