


The difficulty with scheming to deflate a bubble of this order and magnitude is that it will still be impossible to inflate it over again on the next go around. At least not until people have forgotten how they got fooled, again. It happens every time a speculative bubble pops, and the longer and larger the bubble grows, the longer it takes for Wall Street to clean up the mess and eventually re-earn its credibility. The massive paper overhang will take years to absorb, not months. The party is over. It may be about time to make room for…
What a grand title. It deserves a mention because it came to mind as I was searching for something descriptive for what we have to say to you this week. As I wandered onto the Internet to see if anyone else got it first, I stumbled upon a short history of the Golden Bull of 1356, which was issued by the Holy Roman Emperor Charles IV. I have reprinted part of the paragraph that I found in the sixth edition of the Columbia Encyclopedia (on line). Believe me, it is relevant…
Mindful of the dissension caused by the disputed imperial election of his predecessor, Louis IV, Charles IV devised a series of detailed procedural regulations intended to prevent similar controversies. The king of the Romans was thereafter to be elected only by the majority vote of seven electoral princes. The Golden Bull sanctioned a long-developing trend against a centralized empire and gave the electors a constitutional basis on which to consolidate their holdings into sovereign states. It granted them regalian rights over coinage, mining, and the judiciary; conspiracy against them was to be considered lese-majesty. In codifying the princes' independence of imperial jurisdiction, the Golden Bull of 1356 set the constitutional form of the Holy Roman Empire, which with but a few modifications, survived until the empire's dissolution in 1806.
So, they lived happily ever after. What a bullish ending… democracy won. Perhaps it will, this time as well.
Are they ready to let this bull out of the gate?
Yes, the golden bull. We think it about time that gold prices stopped faking us out anyway. With dollar inflation running rampant in most of the other commodities and the designated protector of the international reserve currency (dollar) denying that it is anything but temporary, rising aggression and anti-US sentiment in the Middle East deliberately aggravating this particular problem as well as many others, and with global stock markets that are about to become a significant paper weight for the global monetary system collapsing, the timing and setting could not be better if Charles himself reappeared this week on the COMEX trading floor holding the golden bull up as a reminder of the political legacy it was created from.
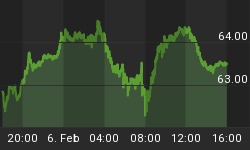
Speaking of COMEX, Gold prices moved up sharply last Monday, breaking out of a very narrow one month (arranged?) consolidation range ($264-$267) near twenty year lows. We noticed. Incidentally, this turns out to have been the narrowest trading range that we have been able to observe since September 1999.

Monthly Gold Prices
The volume in the December contract spiked on Monday, and open interest contracted sharply throughout the week, indicating significant, if not anxious, short covering. Indeed, the week's contract volume (287,000) is the highest weekly volume figure on record since October 1999. Yet dollar bulls were able to place a price cap near the edge of the six-month (down) trend line. Still, watching the tape last week, it was interesting to note this strength in the face of economic data, which continues to point to a material slow down in economic (stock market) activity.

What does this all mean for gold besides a greater likelihood that it is the inflation rather than aggregate demand, which is the larger influence on hard asset prices today? It means that recent sellers are closing off their short positions, and probably throwing in the towel on the hoped for break to new lows. Though I have also seen this whole pattern before, in other (rigged) markets. It often means that the shorts are getting long. Perhaps, this time will be different.
We mentioned to you last week that Palladium prices were poised to launch into orbit. They did. They were up $48 last week (over 5%) and closed at new highs along with Platinum prices, which also closed right at their highest trading point on the week (+5%), though a hair below their own all time highs.

Palladium - Weekly
GS Precious Metals Index
Even copper prices bounced strongly off of trend support to finish up over 5% on the week. Thus I was puzzled by the late Friday sell off in oil prices. Oil prices closed weak on Friday as the International Energy Agency said it was prepared to take emergency action and to coordinate the release of strategic petroleum reserves in order to thwart an economic debacle, according to the International Herald Tribune this weekend. Yet the same day, Iraq threatened to halt all exports in order to extort a surcharge from the UN, in Euros. It is amazing how hard the authorities are working to convince themselves and others that there is indeed a shortage of crude on the world market. If we are correct (and we really believe that we are) and this is a dollar crisis rather than an energy crisis, the "allies" are going to run out of crude to fight it with, quickly.
Especially if they lower interest rates… there is no better way to guarantee a monetary crisis at this point in time than by executing the Greenspan Put yet again in response to an economic crisis of any kind. Yet, there is no better way to guarantee an economic crisis at this point in time, than by taking back some of the liquidity upon which lays an entire pyramid.
As a trader, I am beginning to sense that feeling that I get whenever I know someone is going to try and fight a battle they cannot win. It is the same feeling I used to get knowing that I just saw the winning goal in a hockey game, or the same feeling that anyone would get, I think, at that moment when they perceive a definite outcome. If our government insists on throwing scarce crude onto the inflation inferno, and if the Fed decides to step on the (monetary) gas pedal with ever-lower interest rates, we will have single handedly surrendered both our weapon and our ammunition. But I guess that this is just another patent example of our (dare I say) desperate government. So, our Oil conclusion is for higher prices again this week!
It is unclear to me what is going on in Silver markets except that maybe Warren Buffet is doing the Fed a favor (just kidding I think)? For, the Silver Institute (and SafeHaven) just reported (November 27) that the US Defense National Stockpile Center has committed to deliver its remaining 15 million ounces to the US mint for coinage programs. Coinage programs? Anyhow, that is really a bullish fundamental development for silver prices, because in the sixties/seventies this stockpile (165 million ounces back then) was actually used to manipulate silver prices.
Yet, even as this enemy stockpile vanishes into thin air, silver prices have been trading as if demand were suddenly overcome with enormous near term supply. Are these stockpiles finding their way back into the market again? While that is consistent with this administration's choice of action in oil markets, it is extremely dangerous for them to do this with so few bloody bullets! Have our leaders become that desperate that they have to sell their remaining silver and oil supplies to keep the party going for just a little bit longer? Or have they really convinced themselves that the current economic circumstances are temporary and that these actions will therefore work?? This is seriously becoming not funny.
The Case for Gold Goes Un-represented
Most industries fund an organization like the World Gold Council in order to promote their self-interests and to facilitate communiqué to the public about what the industry is up to. Usually, I also find that most of these industry groups have relatively good market information, but the WGC falls short even there. In conducting my research this week, I concluded that the US Geological Survey did a marginally better job at providing me (or the prospective investor) with relevant information on the gold industry than the WGC.
And appropriately, the Council's US membership has taken it upon itself now to form the world's first online jewelry magazine. No kidding… I asked my wife, she should know… there is no such thing, until now. Good idea if you want to sell jewelry, but that isn't why I have brought this up… it gets worse.
The title of the marketing campaign is Gold Fashioned Girls -- Fine gold jewelry gets first ad push in almost five years, with “GOLD FASHIONED GIRLS” campaign.
So they have resorted to selling sex - the oldest, surest marketing method that ever worked - in order to persuade you to buy more “jewelry”. If you happen by their website, you might notice that their WELCOME page looks more like the cover of a new magazine for Tiffany's than an informative industry publication. It might work to up-tick Christmas jewelry demand, and the Americans will have to receive credit for promoting gold demand if it does... only in the good old US of A, eh?
Unfortunately, the campaign works much more effectively as a disincentive for prospective bullion investors because although jewelry consumption is a significant component of annual gold demand, the information that the jewelry “consumer” requires to make a valuation decision and the information, which the investor requires to make the same decision are very different. For one thing, one consumes the other saves. In other words, the consumer of gold jewelry needs to know little about the variables that affect the purchasing power of the dollar, while the investor has little need to know how an 18 k gold necklace looks like on the likes of Pamela Lee Anderson.
Why am I discussing this? Because I have never seen anything like it.
Investors are looking for a catalyst…
They might as well be looking for a three-legged lawyer on Capitol Hill. The media talks in terms of catalysts because its job is to interpret complex financial developments in the simplest terms, for its viewers. Furthermore, catalysts may influence a short move, but primary trends never begin on a catalyst. They just begin and end. In our experience, fundamentals change far ahead of the technicals at major market turning points. This is because the longer a trend persists; the more confident is the prevailing market psychology and thus, the less visible are the opposing forces. Professional observers (provided that they do not get too carried away with the prevailing trend themselves) should be able to spot these changes, we think, and in any case often accumulate or liquidate a large position before a catalyst actually arrives.
Thus, even while some news or other development always exists to relate to a changing market trend, the fact is that it will be incidental to the “primary” under current of the market. As you know, we feel that the primary trend for stocks has turned down and the primary trend for real things that you can use, like oil, palladium, platinum, copper, real estate, and now maybe even gold, has begun to turn up. Even more bullish is the probability that these changes have yet to be widely recognized.
Frank Cappiello for one doesn't believe they have arrived yet. He says that if this were the case, then the rest of the stock market would have soared by now! Soaring stock prices on Wall Street with dollar inflation exploding all around it? Over the long run, you will find that stock prices actually generally decline when there is inflation. Indeed, the opposite environment is what produced this stock market extreme (delusion) in the first place. What Frank probably means to say is that first, stock prices will generally collapse, as they did in 1973/74, and then they would soar off of much lower levels on the new commodity-stock leadership - as they did several times in the late seventies when the big oil multi-nationals delivered big paper profits to shareholders, a good portion of which were derived from gains made trading inventories.
Gold Funny-mentals; the first component of the gold price
If you asked a colleague to name the two economic laws, which influence the price of any good, they would probably tell you that supply and demand, do. But that is actually only one law. Let's discuss it here. For if you think that there is a fundamental shortage of oil on the world market, just wait until you consider some of the fundamental developments in the gold business, which have evolved over this past decade.
The top six gold producing countries contributed to nearly two-thirds of total world gold production in 1999.
| Metric Tons 1999 | % share of world market | % change in Reserves / 1990 | Change in rate of production / 1990 | |
| South Africa | 450 | 18 | 0% | -26% |
| USA | 341 | 13 | 10% | 16% |
| Australia | 300 | 12 | 74% | 23% |
| China | 170 | 7 | n/a | 70% |
| Canada | 158 | 6 | 67% | -7% |
| Russia/Uzbekistan | 211 | 8 | 26% | -30% |
| Total (world) | 2,534 | 100 | 16% | 16% |
Observations
World gold reserves have expanded at the rate of about 1% annually since 1990, somewhat less than the normal 3% replacement rate recorded over the long run, while world wide demand has grown by over 30% since 1992, nearly 4% annually (I could not easily find data before 1992). Central bankers have been kind enough to supply the shortfall in jewelry demand with your money. Thus, the question to ask here is how much has leasing activity, the gold-carry trade, and direct central bank selling affected price discovery in gold prices, which had led to a subsequent decline in the overall exploration incentive (the discovery of additional reserves), and thus restricted production rates?
Data from MEG (metals-economics) and the US Division of Minerals reveal that world exploration budgets have contracted by nearly 50% since 1997, but that does not include this year, which is unlikely to have gotten better. The data only includes exploration budgets from a large sample of producers and/or governments, not the junior mining industry, which actually is much more significant. In the two years (1996/97), Canadian junior mining players collectively raised nearly $3 billion for exploration, and it's all gone, presumably on exploration. To put that in perspective, the USDM data shows that the total world exploration budget for 1997 was $1.1 billion. The point is that venture capital markets are the most critically important element in the overall level of exploration, for gold in particular. This is not the case in oil markets, where the cost of exploration is often too high for the venture capitalist to afford.
Hence, without the prospect for replacement reserves, it is unlikely (or even risky) for producers to produce too much at a low gold price. If they step on the gas, the thinner bottom line at low prices will not help their effort to fund new exploration. Rather, they would be going nowhere faster. We have observed a visible, but slightly lagging, influence on production rates from reserve growth, or depletion.

The correlation coefficient between reserve replacement rates and production rates is 0.76, but that is easily explained by a visible 12-month lag in the production process. Thus, the number is likely much closer to 1 than the data reveals. I think you can see that for yourself in the chart above. Had replacement rates from 1990 to the present stayed near the long-term average of 3%, total world gold reserves could be expected to have grown by an additional 6000 tons, 13% of the current total.
Using the data above, it is conceivable that mine production therefore, could have approached 2900 tons in 1999 rather than 2534, which could have reduced the need for central bankers to provide the extra liquidity to the market in the first place, to satiate demand, which currently runs near 3200 tons (1999).
Theoretically, at least, we might expect that when the artificial central bank selling pressure ceases, the gap between demand and supply alone (demand exceeded supply by about 700 tons in 1999) ought to become visible enough to send gold prices on an exploration incentive creating binge. Since the signing of the Washington Agreement then, something should have happened. It did. Gold prices began to rise in Australian dollar terms, Canadian dollar terms, South African Rand terms, and more recently, in Euro terms.
Normally, these currency shocks should trigger a rapid rise in gold production, but were it not for an outsized production hike in Uzbekistan, global production would have actually declined in 1999. But 1999 is largely irrelevant because the W.A. was signed at the end of the third quarter, and also because we have found a six to twelve month lag between the time that the market signals producers and producers (wake up) bring new production on line, if that is even possible (we will know better when we get the data for this year).
However, besides very little replacement activity, also hindering the production process is that South African producers face escalating health problems (read costs: 50% of the population has aids?) and mine depletion (at these prices), which will inhibit production for many dollars per ounce yet. Although Canada's reserve base has grown nearly as fast as Australia's, Canadian gold producers face political and bureaucratic bottlenecks in the production process, which continue to choke off even current production. Australian producers have been aggressive sellers of gold forward contracts over the past few years, even though production rates have steadily tapered off since 1997. Thus, their medium term firepower may be in low gear for a while, especially if the dollar tide turns on them.
That leaves Russia, China, and the USA as the only source of additional marginal nearby gold supply. And should Al Gore win the Presidency, we will have no choice but to expel the USA to the preceding paragraph. Nonetheless, the already changing dollar tide may make it difficult to keep the market well supplied anyway.

The main reason is that a declining dollar will mean a declining price of gold in Aussie dollars, or Canadian dollars, or Rand, or Chinese Yuan. Thus, if you think that politics, shrinking reserve bases, or slow replacement rates in the world's gold business can hold back production rates, you ain't seen nothing yet. A weak dollar will unexpectedly squeeze foreign producer's profit margins, which will force them to consider production cut backs just as the dollar price of gold begins to soar.
What of Official Sector Gold Holdings?

We did not include official sector holdings in our previous calculations of growth in world gold reserves because if we did, the figure would only be more bullish - they have been on the steady decline for a while. In the above chart we included these holdings, though without deducting outstanding gold leases (loans) or derivatives exposures. Calculated this way, the rate of growth in world gold reserves is stagnant over the past ten years, making the outlook for future supply shortfalls/shocks all the more likely.
Pay little attention to people who divert your focus toward low short-term lease rates in order to prove to you that there is no supply/demand imbalance, for these rates are less relevant than ever today. Effectively, the Washington Agreement prevents any fresh “liquidity” from moving into the “lending pool”, and the post agreement (violent) price swing all but killed borrowing demand for the shorter-term leases… thereby effectively shutting down the lending pool and rendering lease rates ineffective, or at least highly questionable, at measuring disturbances in either the physical or lending markets.
Just for fun, lets consider what official sector gold holdings may look like after deducting a few things, such as gold leases outstanding and net derivatives exposures. I will omit deducting producer hedges because there would likely be some overlap and double counting included with the result.

*Source of data: World Gold Council and the Gold Anti Trust Action committee
At the end of 1999, total official sector gold holdings stood at 33,400 metric tons, according to data from the World Gold Council. However, a declining dollar may force analysts to assume that claims on both, the bank's outstanding leased gold and their cumulative net derivatives exposure, will be at risk. Consequently, there is a net drain of about 15,000 tons off of the top figure, which leaves the official sector with only 18,000 tons (or 45% less).
These are conservative, widely accepted figures. Consider GATA's calculations on the total amount of gold actually leased/hedged, and you might as well deduct at least another 6,000 tons off of that figure, leaving the world's central banks with less than 12,000 tons of gold to back their currencies… a potentially significant problem.
Investment Demand
According to data from the World Gold Council, US, European, and Japanese gold demand in the third quarter appears to be recovering from its Y2K indigestion, while generally speaking most of the growth in demand over recent years has come mainly from the Middle East (mostly Saudi Arabia, Egypt, and Turkey).
It is interesting to see the WGC try to prove that gold demand falls when gold prices rise, and it rises when gold prices fall. I cannot be certain why they try to promote this fallacy because if you look at their data you will notice that they are careful to compare each demand data series against their choice of whether the gold price should be graphed in US$ or in the local currency. If you take out this baloney, you will find as many examples of rising demand on rising prices as you would with rising demand on falling prices. It is a ridiculous point, at least to the degree in which they choose to promote the concept.
Anyhow, Asian demand trends were not entirely clear, due to unhelpful data presentation surrounding the effects of the '97 Asian crisis on gold demand. However, maybe this says it all:
Advice presented to the Chinese government on the transition of the nation to allow for private gold ownership… according to a Chinese news agency (though it wasn't clear as to who the “advisors” were):
The first stage is to open a gold exchange, restructure the present policy of state monopoly of purchase and allocation of gold and related management mechanism, allowing the exchange to complete the task of linking production with marketing and set the gold price in reference to the international market.
The second stage is to improve the market mechanism while opening the domestic market in an all-round way, and allow residents to hold gold investment products and participate in gold trading.
The third stage is to internationalize the market to make it a component part of the international market.
Up until now, the Chinese government has strictly controlled the price of gold at which it, and only it, buys gold from domestic producers. The government raised gold prices by roughly 100% in 1993 and then since 1997 has allowed them to drop by 25% to $US 9.00 per gram ($260/$280 per ounce).
Dollar Inflation; the second component of the gold price
What do we need gold for anyway if we've got the dollar? Apparently nothing if prices continue to decline relative to the US dollar, though, since when is anything good for anything when prices only decline? I remember when oil prices declined from $20 to $10 in 1998. How many people do you remember telling you that oil was not necessary to us in the new economy? We know who talked the talk, and we knew then that the talk was not true, but we also knew that humans would believe it to be true as long as prices continued to decline. Many investors believe that stock prices go up because of fundamentals (or a catalyst)… as if some mysterious force (the invisible hand perhaps) was recognizing these fundamentals and adjusting the market accordingly. Of course, this is the ideal market condition; but unfortunately we cannot trust the market mechanism today because as we have shown in past commentary, discretionary monetary policy has skewed / distorted it. Thus, fundamentals do not make the market go up anymore, cheap, soft, and dishonest money does.
This is called inflation and consequently, it is through the artificial rise in US asset prices that the Fed (or Treasury) manipulates (raises) our confidence in dollar denominated assets. In other words, the invisible hand has been replaced by the Federal Reserve System, which now gives fresh money to certain preferred junkies every time they run out.
So now that you know what really makes stock prices go up or down, guess what happens to the psychology of a nation who has been deluded into believing that their markets are free and operate efficiently, when these mysterious monetary forces are making them feel wealthy? That's right, we're doing things right! We must be, why else would our stock market be rising at record speed over the past few years? Yet the evidence suggests that our markets haven't been working all that efficiently.
How does one reconcile the accelerated volatility in global financial markets, and perhaps in our economies, with the efficient market hypothesis? If we are all working hard to make this market efficient, shouldn't markets be closer to their theoretical equilibrium, and therefore demonstrate less volatility? Well, having a decent market background and mediocre observation skills, my confidence that the market mechanism in virtually anything denominated in dollars is working properly these days is very low indeed. There is excessive monetary influence, and it is acutely unprecedented. The evidence suggests that the Federal Reserve System no longer manages the money supply. Instead, it is managed by the private banking system and the paper they are issuing is not dissimilar from the days when US banks were able to issue their own notes. Do we need to connect the dots? Have another look at the credit bubble. Every credit issued by any bank is money. Thus all money that has been issued is backed by debt. But heck, we have so much productivity going for us here in the United States:
Lower interest rates will not get stocks going again!
The Fed and Wall Street dealers have been “trying” to lead new liquidity toward the value end of the stock market in order to try to deflate this thing in an orderly manner. A sensible way to deal with a problem like this one, but it is not working. Instead, this liquidity has been chasing after things that inflate, duh. Such as oil and other real things. For value is always in the eye of the beholder and the beholder, as we have been pointing out, has increasingly been beholding higher values in the store of oil and gas than in the store of dollars.
I bring this up again because of how loud the call for lower interest rates is at the moment. It is amazing to watch Wall Street's long kept secret comprehension about the “Greenspan Put” publicized everywhere; it is intriguing to watch stock jobbers all over the continent become passionate buyers of more stock on the "Grande" premise that the Fed will always save the stock market. This psychological influence cannot be understated as the repeated execution of this increasingly wrong monetary response has single-handedly wiped out many bears along the way. Some of these bears conceivably read the right signals, except that they perhaps didn't consider how high a roller(s) they were dealing with and how much moral hazard the Fed was willing to take on.
Anyhow, here we are today with speculators everywhere throwing their blue tickets (buy orders at most firms) right at Mr. Greenspan's doorstep, for his signature on yet another put. Yet, it hasn't been working with the broad stock market for nearly two years, and it hasn't worked for the economy recently nor has it worked for consumption as of late. But again, we point out that it has worked for commodity prices, internationally. Recall the charts where I showed you that the changing rate of return on financial assets has not kept pace with the changing rate of return on hard assets. Now why would more liquidity (money) suddenly do what it hasn't really been doing? That is, go into the stock market.
Bears line up behind the Golden Bull
I said last week that the bulls would have to come to the ball game and put in a show of strength (if this market is to decline at a slower rate over the long run), this week. In many market situations, the same is true of the opposite team (the bears in this case) in any particular week. We think, however, that considering the extreme levels of optimism implicit in the put/call ratio at the beginning of the week, as well as a few other developments, that the bears had a decisive edge. Consequently, it is equally important to evaluate their performance last week.
In action overseas, the weighted French CAC stock index led European equities lower, by falling 3.53% on the week, even though shares in the Netherlands and in Switzerland put in a good performance. Meanwhile, the Nikkei bounced nicely, up 3.63% (didn't we say something about a bottom in here last week?), which gave stock markets in the region a mild boost. Most of the world is focused on the action in US markets, however, which continue to lead share prices on this continent, down.
The bears were all over the Nasdaq, tearing into the bubble like they were in for a cold winter. The Nasdaq100 gave up the most, down nearly 10%. The NYSE Composite faired the best, down only a tenth of one percent on the week.
 NYSE Composite Index |  NASDAQ Composite Index |
Bullish industry leaders on the week were, brace yourselves… Gold (XAU +9.18%), Insurance (IUX +4.86%), and Retail (RLX +4.76%) issues. However, the Dow leadership last week represents neither of the first two.
Dow stocks: > 5% on the week
| Last Week's Dow Leadership | Last Week's Dow Dogs | ||
| Wal-Mart | + 13.28 % | Intel | - 22.33 % |
| Alcoa Aluminum | + 11.02 % | Microsoft | - 19.03 % |
| International Paper | + 7.02 % | ENE | - 15.75 % |
| AEP | + 6.13 % | WMB | - 14.00 % |
| ABF | + 5.97 % | NWAC | - 13.49 % |
| Phillip Morris | + 5.79 % | Hewlett Packard | - 9.50 % |
| American Express | + 5.60 % | McDonald's | - 8.16 % |
| Coca Cola | + 5.38 % | SBC Communications | - 8.05 % |
| AES | - 7.49 % | ||
| Eastman Kodak | - 7.35 % | ||
| U | - 6.59 % | ||
| Burlington Northern | - 6.23 % | ||
| Exxon | - 5.95 % | ||
| YELL | - 5.19 % | ||
The bears obviously won the week. We thought they might. The charts were screaming sell last weekend, yet sentiment polls were showing rising bullishness as if the bulls had suddenly learnt how to become contrarian?
There were five different technology sectors that were down double digits, led by the SOX, off by 20%. Close behind it were among this summer's stronger bulls, the Disk Drives (DDX -18.53%) and the Hardware sectors (HWI -16.86%). Then of course the Internets (DOT -11.57%) and the Computer tech index (XCI -11.49%) got shot down, again. The only other industry group, which was off double digits on the week, was the oil services (OSX -11.46) group on concern that issues have been recently overbought.
Although the Nasdaq got hammered all week long, including Friday actually, the NYSE composite and the Dow survived the assault until Thursday when both of them temporarily spiked through panic territory (support) intraday. The Composite seems to developing a bearish 2-month continuation pattern; while the Dow Industrials are busy building a one-month descending triangle... if this is a bear market, then they should break, especially considering the increasing weakness in the other averages. We thought that the break would occur last week and it might as well have, for Friday's soggy rally didn't change our mind one little bit.
What is on tap for this week?
This week can get a whole lot worse for equity markets, or they could begin to look better by Friday if the bulls defend these levels successfully. The statistics are only beginning to move to their favor for a rebuttal. The NYSE advance decline line showed a nice recovery of most of the week's losses, but much improvement needs to be done there if this market is to rally materially, without help from the Fed. The Nasdaq is now so beaten up that it has approached its 200 “week” moving average but it has to demonstrate a better performance than it did on Friday, or Monday, in order to muster up anyone's confidence.

They are not yet the right conditions for a meaningful bounce, though the right conditions might appear at some time this week. However, not before stock markets discount the worst-case scenario for the upcoming earnings season, the economy, and dollar, among other things. Furthermore, because it seems that the stock market cannot tempt fresh capital with the mild sell offs it has managed so far, that bulls might just get what they ask for... a selling climax. Only this one may put them out of business for a while.
Notwithstanding, US long bonds were generally flat on the week while shorter dated securities rallied. Naturally, the yield curve normalized somewhat on the prospect for a slower economy, or at the very least on the speculation for lower interest rates come December 19. The heavily watched employment report is due out on Friday, and it is certain to be a market mover. Over the next few weeks, we suspect that more earnings disappointments will trickle out of the private boardroom meetings, as analysts marvel at how much money companies tell them that they have recently lost in their stock portfolios.
The US dollar was down against most fiat currencies as well last week, but it was up slightly against the Canadian dollar and the Japanese yen. [To offset the passing of the baton to the ECB, will the Fed see it to its advantage to re-ignite the Yen carry? Ah... yes indeed it will, for we can't have any competition for the next reserve currency, can we? Besides, it cannot be seen as dollar weakness, it has to be seen as relative Euro strength... perhaps this is why the press has been highlighting the risks to economic growth in the Asian region, though I have yet to hear them begin chanting Euro prospects] The Euro, however, rallied impressively (+4.5%) against the dollar on the week. While the move in no way implies an important shift in the technical condition of the market, it appears to have certainly injected a bullish bias for the short run. After making a higher low last week, this week's move put in a higher high. What lies ahead, however, is significant trend resistance at $0.90... a couple of pennies above Friday's close.
The Fed has been weakening the integrity of our reserve currency, the dollar, by issuing too many notes, but it is our irrational exuberance, which will have compromised our negotiating position with the rest of the world on world currency markets.


