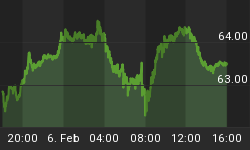
The S&P 500 closed out the first week* of November with a -0.63% loss on the day, trading lower -2.48% week-to-date, and is almost unchanged month-to-date (or to be exact down only -0.01% month-to-date).
Historically the S&P 500's performance during the first week of November provided a good indication of the market's short-term performance right at the start of the then following week, in this event on Monday, November 7.
First of all table I below shows the S&P 500' performance metrics for the then following session (the 1st session during the 2nd week in November) in the event the S&P 500 closed out the 1st week in November with a (from the left to the right)
- 2.0%+ gain,
- 1.0%+ gain,
- gain (> 0%),
- all occurrences,
- loss (< 0%),
- -1.0%+ loss,
- -2.0%+ loss
week-to-date.
Apparently the better the S&P 500 performed during the first week of November, the better the chances were that the index continued its uptrend right at the start of the then following week, and vice versa.
When the S&P 500 was up 1.0%+ during the first week of November, the index was up as well on the first session of the then following week on every 2 out of 3 occurrences (up on 25 out of a total of 38 occurrences), gains more than doubled losses (Profit Factor of 2.25), downside potential was limited (max. loss of -1.21%, and a median losing trade of -0.37% only), and a t-score (Student's t-test) of 1.95, exceeding the critical +/- 1.645 mark for statistical significance (in order to check if - and to what extent - any deviation from at-any-time returns occurred by pure chance only).
Inversely the respective performance metrics in the event the S&P 500 closed out the 1st week of November with a loss (of whatever size). The index was then down as well on the first session of the then following week on every 2 out of 3 occurrences (down on 18 out of a total of 27 occurrences), losses more than doubled gains - if any - (Profit Factor of 0.41, 0.25 and 0.02 respectively in the event the S&P 500 closed out the first week with a loss of -1.0%+ or -2.0%+), and a t-score (Student's t-test) of -1.61, -1.73 and -2.94, exceeding (again) the critical +/- 1.645 mark for statistical significance.
Table II below now shows all historical occurrences and the S&P 500' performance over the course of the then following 1 to 5 sessions (the 2nd week of November) in the event the S&P 500 closed out the first week of November with a loss of -2.0%+ week-to-date (as it did on November 4, 2011).

Although nine occurrences only since 1930 is nothing to read anything statistically significant into it (but it comes on top of a negative trend in the event the S&P 500 closed out the first week of November with a loss week-to-date), it is at least interesting to note that even in the event the S&P 500 closed up on the 1st session of then then following week (see 11/04/1994), it did not manage a close gt. +0.84% above the trigger day's close over the then following two weeks (not shown) and finally closed below the trigger days close ten days later.
Successful trading,
Disclosure: No position in the securities mentioned in this post at time of writing.
* The first week of the month is the first week that contains a Thursday. This is based on the ICU definition of week of month, and correlates to the ISO 8601 week of year definition. A day in the week before the week with the first Thursday will be week 0.


