


12/22/2011 10:08:37 AM
Here's our view as we move into year's end.
First, a little focus on today. I still see the markets pushing higher. I see the dollar and bonds weakening. The extent to which bonds weaken will determine the markets upside.
Again running a little late this morning as I've been building a new data base with some more indicators, looking deeper at oil (as I periodically trade oil) and the relationship inside some of the components of the market as I seek out building a pure retirement based bond stock reallocation timing program. It's a way to maximize the returns of your current holdings, while taking on no risk (actually, lessens risk) and also advising when to put new money to work. It's geared towards anyone with roth/401k/retirement or educational account. I'll be using it in one of my accounts so I can report back on real time performance.
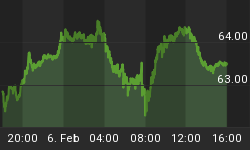
Here's a look at the global markets:

On the economic front, here is the schedule for this week. Pay close attention to the timing of the report and the potential for the markets to make short term reversals at those points.

On to the charts:

Stock Barometer Analysis
The barometer remains in Buy Mode. I'll feel more comfortable if it would break this pattern of lower highs, and if it turns lower here, we will go into sell mode.
The Stock Barometer is my proprietary market timing system. The direction, slope and level of the Stock Barometer determine our outlook. For example, if the barometer line is moving down, we are in Sell Mode. A Buy or Sell Signal is triggered when the indicator clearly changes direction. Trend and support can override the barometer signals.
Money Management & Stops
To trade this system, there are a few things you need to know and address to control your risk:
• This system targets intermediate term moves, of which even in the best years, there are usually only up to 7 profitable intermediate term moves. The rest of the year will be consolidating moves where this system will experience small losses and gains that offset each other.
• This system will usually result in losing trades more than 50% of the time, even in our best years. The key is being positioned properly for longer term moves when they come.
• Therefore it is vitally important that you apply some form of money management to protect your capital.
• Trading a leveraged index fund will result in more risk, since you cannot set stops and you cannot get out intraday.
Accordingly;
• Make sure you set your stops so that you can lose no more than 2% per trade (based on the QQQQ if you're trading leveraged funds and options with our trading service).
Potential Cycle Reversal Dates
2011 Potential Reversal Dates: 1/15, 1/29, 2/16, 3/10, 3/18, 4/6, 5/21, 5/31, 6/13, 6/24, 7/16, 8/1, 8/19, 9/4, 9/25, 10/21, 10/25, 11/25, 12/26. We publish dates up to 2 months in advance.
With our next key reversal date as 12/26, we generally would look for the markets to move higher into this period. We'll start looking into our 2012 dates this weekend and start publishing them next week.
As we approach a key resistance date, and the markets don't do as we see, obviously the risk for inversion grows. This move may return to pushing lower again into next week. And have a much more muted rally.
My Additional timing work is based on numerous cycles and has resulted in the above potential reversal dates. These are not to be confused with the barometer signals or cycle times. However, due to their past accuracy I post the dates here.
2010 Potential Reversal Dates: 1/19, 1/28, 3/2, 3/23, 4/7, 5/30, 6/10, 6/28, 7/10, 8/13, 9/7, 10/2, 10/27, 11/21, 12/19. We publish dates up to 2 months in advance. 2009 Published Reversal Dates: 1/20, 2/11, 3/7, 3/15, 4/8, 4/16, 4/27, 5/7, 6/8, 7/2, 7/17, 9/14, 10/10, 10/24, 11/12, 11/30, 12/9, 12/21, 12/29. 2008 Potential Reversal Dates: 12/31, 1/11, 2/1, 2/13, 3/6, 4/5, 4/22, 5/23, 6/6, 6/27, 7/13, 9/2, 10/3, 10/22, 11/10, 12/11. 2007 Potential Reversal Dates: 1/10, 1/14, 1/27, 1/31, 2/3, 2/17, 3/10, 3/24, 4/21, 5/6, 6/15, 8/29, 10/19, 11/29, 12/13, 12/23, 12/31, 1/11/08. 2006 potential reversal dates: 1/16, 1/30, 2/25, 3/19, 4/8, 5/8, 5/19, 6/6(20), 7/24, 8/20, 8/29, 9/15, 10/11, 11/28. 2005 Potential reversal dates: 12/27, 1/25, 2/16, 3/4, 3/14, 3/29, 4/5, 4/19, 5/2, 6/3, 6/10, 7/13, 7/28, 8/12, 8/30-31, 9/22, 10/4, 11/15, 11/20, 12/16.
Timing Indicators
Use the following Timing/momentum indicators to assist in your trading of the QQQQ, GLD, USD, USO and TLT. They are tuned to deliver signals in line with the Stock Barometer and we use them only in determining our overall outlook for the market and for pinpointing market reversals. The level, direction, and position to the zero line are keys in these indicators. For example, direction determines mode and a buy signal 'above zero' is more bullish than a buy signal 'below zero'.
QQQQ Timing Indicator (NASDAQ:QQQQ)

The QQQQ Spread Indicator will yield its own buy and sell signals that may be different from the Stock Barometer. It's meant to give us an idea of the next turn in the market.
Gold Timing Indicator (AMEX:GLD)

Want to trade Gold? Use our signals with the Gold ETF AMEX:GLD. Gold gives us a general gage to the overall health of the US Economy and the markets.
US Dollar Index Timing Indicator (INDEX:DXY)

Want to trade the US Dollar? Use our signals with the Power Shares AMEX:UUP: US Dollar Index Bullish Fund and AMEX:UDN: US Dollar Index Bearish Fund.
Bonds Timing Indicator (AMEX:TLT)

Want to trade Bonds? Use our signals with Lehman?s 20 year ETF AMEX:TLT. The direction of bonds has an impact on the stock market. Normally, as bonds go down, stocks will go up and as bonds go up, stocks will go down.
OIL Timing Indicator (AMEX:USO)

Want to trade OIL? Use our signals with AMEX:USO, the OIL ETF. We look at the price of oil as its level and direction has an impact on the stock market.
Secondary Stock Market Timing Indicator

We daily monitor hundreds of popular and proprietary technical indicators that break down market internals, sentiment and money flow to give us unique insight into the market. We feature at least one here each day in support of our current outlook.
As an annual subscriber to any of our premium services, you also get access to all our charts and research. Email Carl@stockbarometer.com to upgrade and also save 20% on your subscription.
Daily Stock Market Outlook
We remain in Buy Mode, looking for the markets to move higher into and through year end.
We have a key reversal date of 12/26. In the short term, we are a little over bought because of Tuesday's large up day.
For today, I see dollar and bonds positioning to support a rally later in the day. But with these markets, and the large randomness in the short term, I don't want to make too strong a call. In fact, I'd generally take this time of year off from trading to enjoy the holidays. But if I see an opportunity, I will jump in for a profit. So I'll be watching :)
On the accuracy of the barometer, if you've been with me for a while, I periodically talk about it's accuracy in higher volatility markets. I believe the line is around 25 on the VIX/VXO roughly where it's accuracy goes up. In high volaility markets, you have to become more of a trader to profit. Systems can be very slow to react. And speed costs you money, or time (as was our case).
That being said, we'll ride this last move as long as we can. If the markets move into an uptrend here, I see it moving higher into Mid January. But then I'd be a seller. Again, I don't like to forecast out too far, because things can change on a daily basis, but I see a sell off coming in Q1.
FYI, links from my 3 videos from the World Money Show will be posted on my website this afternoon (give me an hour or so to get them up) - just scroll to the bottom of the site. I'll leave them up there for the rest of this year. Just click here to get to my home page: stock market timing
You'll also notice I added a row of Forex services and a row of Penny Stock services. This is because I don't have an internal trader that trades these vehicles. So I put out the ones I recommend (because they're top sellers). On that note, the end of the year is the second best time to trade penny stocks. The manipulation is huge! So I'd suggest starting there...
If you want to learn more about some of these indicators, I use my blog to cover them in more detail.
If you're looking for more information, please visit our blog - I'll have updates and publish other articles there. http://investmentresearchgroup.com/Blog/
Regards,


