


ANOTHER PAUSE?
Precision timing for all time frames through a 3-dimensional approach to technical
analysis: Cycles - Breadth - P&F and Fibonacci price projections
"By the Law of Periodical Repetition, everything which has happened once must happen again, and again, and again -- and not capriciously, but at regular periods, and each thing in its own period, not another's, and each obeying its own law... The same Nature which delights in periodical repetition in the sky is the Nature which orders the affairs of the earth. Let us not underrate the value of that hint." ~ Mark Twain
Current Position of the Market
SPX: Very Long-term trend - The very-long-term cycles are down and, if they make their lows when expected, there will be another steep and prolonged decline into 2014.
SPX: Intermediate trend - Intermediate uptrend still intact, but short-term top likely soon.
Analysis of the short-term trend is done on a daily basis with the help of hourly charts. It is an important adjunct to the analysis of daily and weekly charts which discusses the course of longer market trends.
Market Overview
Last week, as expected, the indices continued the uptrend that was started in early October, when the 3-yr cycle made its low and the SPX reversed its decline from 1370 at 1075, with a spectacular 217-point rally to 1292 in less than three weeks. This was followed by a .618 retracement to 1159. Subsequently, the uptrend resumed, but at a much more subdued pace until last week when the index got back within eight points of the late October top.
The recovery high of 1284.62 was reached on the first trading day of the new year, last Tuesday. Since then, the SPX has been struggling, along with the DJIA and the Russell, but the QQQ has forged ahead making a new high on Friday, while the VIX came within 24 cents of its recent low.
Clearly, we have a short-term fragmented market. The Dow Jones Industrials and Transportation are the only major indices which have surpassed their October highs but, over the long term, the QQQ (NDX) remains the strongest equity index since the 2009 low, with the DJIA a close second.
With their daily indicators overbought, equity indices are in need of a near-term correction. But since there is no sign of negative divergence in any of them, I would expect it to be a short-lived 3-5 days before there is another attempt at resuming the rally. If negative divergence does develop in the daily momentum indicators, a longer correction could ensue. From a cyclical standpoint, the 3rd or 4th week in January appears to be better suited to bring about a short-term top than the current time frame.
Chart analysis
We'll start with the Daily Chart of the SPX.
Longer-term you can see how the band of resistance between 1260 and 1370 has halted the rally from the 1075 low. The intermediate trend from that level is confined to a wide channel which is marked by two purple trend lines. The lows of that trend have recently been accelerating upward, which would be bullish, except for the fact that the tops have been limited to the high of the first rally. If the SPX can overcome 1292, it could challenge the red downtrend line which is currently at about 1335. Considering the status of the indicators, that would be a tall order right now.
Not only is the MSO overbought, but the A/D indicator is showing negative divergence. The trend lines on the indicators match the trend lines from the secondary bottom of 11/28. If they are broken, it will be a preliminary sell signal, especially since this would also take them below the horizontal red line which marks their former near-term low. Normally, when this happens, there is one more price rally which goes to a new high, but which fails to make a new high in the indicators. That creates negative divergence and signals that the index is ready to make a short-term top. Although this is not a sure thing, I am assuming that since this process is still taking place, we have not yet made the final high of the rally, and the SPX will still have a chance to get up to its 1293-94 target.

The Hourly Chart shows more clearly the deceleration pattern which has taken place in the SPX over the past week. It could be the type of distribution that signals a top, but it could also be a re-accumulation pattern before the index moves to a new high.
For now, it looks as if the uptrend is shifting from the green channel to the black one. The pink horizontal line at 1259 shows a potential target for the correction -- if it comes right away. It was determined by a P&F count of the right half of the pattern. It also corresponds to a move down to the bottom trend line of the expanded channel where it would find some additional support from a return to the broken red downtrend line and, slightly lower, from the 200-hr MA which is now rising once again.
Something else to consider is that, with the sideways price pattern, the indicators have already had an opportunity to correct their overbought conditions, and are now closer to the bottom of their range, meaning that it would take very little price correction to get them ready, once again, to give a buy signal.
Another reason that I do not expect a major decline from here is that, from a purely technical perspective, there are plenty of other trend and channel lines that would have to be broken (including a lower one that is not shown on the chart). These are all in uptrends and would be likely to provide support if the decline should extend to their levels. There are also other bullish factors that have been mentioned before which will be addressed later.

Cycles
A minor cycle which is due in the middle of the month is probably getting ready to pull prices down for a few days.
Breadth
The Summation Index (courtesy StockCharts.com) continues to move up, along with its RSI. As long as it does not turn down, we cannot assume that a top has been made -- even a short-term top. The other thing is that, in a market uptrend, the RSI tends to become overbought before rolling over. In this case, the RSI is getting close to becoming overbought, but is not, yet. That pretty much confirms the picture given by the SPX charts, above.

Sentiment

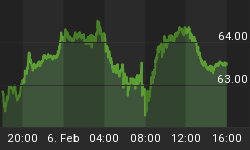
The VIX (above) is becoming my sentiment indicator par excellence. In the past, I had casually looked at it when I compared it to the stock market, but lately, I have delved into its subtleties and discovered what an accurate forecaster of market trends and reversals it is. Its recent performance, including Friday's, is one of the reasons I believe that the market is not ready for an important top at this time.
A Weekly Chart does not change much from week to week but, as you can see, last week the VIX went down again, thereby confirming the continuing uptrend in the equity indices. In the last issue, I showed you in great detail what is needed for the VIX to signal that it is ready to call a market top: 1) It must turn up, and 2) this does not normally happen unless positive divergence has materialized in its indicators.
Look at the indicators! Are they signaling a market top? The answer is clearly, No! So we won't rush into making a premature forecast, but we will wait for a clear signal.
BONDS (TLT)
Because TLT has also been such a good predictor of market turns in the past, it also deserves our scrutiny every week. Last week, I showed its weekly chart. This week, I will show the Daily one.
This chart turned a tad more negative, last week. The previous week, the index breached its intermediate uptrend line from July, found support on the channel line, and bounced back inside the channel at the end of the week. Last week, TLT gapped down, exited its intermediate channel more forcefully, and closed outside of it.

Let's be clear, the index is not yet in a downtrend. It is simply making a move sideways which could either be accumulation or distribution. The indicators are suggesting that the odds favor the latter. In fact, its chart is very similar to GLD's daily chart (below) about a month ago, and there is a good possibility that it will turn out the same way in the weeks ahead. Last week, the indicators made a new low, which increased the negative divergence in the MACD. This is an indication that TLT is probably ready to roll over and continue its intermediate correction. For now, the P&F chart is calling for a decline to about 110. It may be adjusted in the days ahead.
UUP (Dollar ETF)
The Daily Chart of UUP shows the index continuing on its trek upward into what is most likely an inverted 25-d cycle top which could come as early as Monday. It is also approaching an unfilled gap (light blue lines) which dates back to January of last year and which, after a little consolidation, it may try to fill.
The weekly indicators are overbought, but have neither turned down, nor given a sell signal, so we must still think of the trend as being up. This is obvious on this chart. The index is in a short-term uptrend (green channel) within a longer uptrend. From the behavior of the indicators, we can conclude that the short-term trend is about to end, probably when it reaches the top of the 25-d cycle inversion.

How will this affect the performance of the SPX? Although the path of UUP (i.e. the US $) has not always shown a marked inversion to the SPX, is has still remained essentially consistent. In the past four days, the strength in the dollar has only managed to keep the SPX in a sideways trend instead of turning it down. And the QQQ ignored it completely by having a nice move up last week. Perhaps traders feel that the dollar's little burst of strength is a blow-off move into the 25-d cycle high; that it is not the beginning of a significant move, and that when the dollar turns down early next week, the SPX, DJIA, and Russell -- which spent last week consolidating -- will be ready to continue their uptrends.
This is another reason why I do not think that we are at an important top.
GLD (ETF for gold)
Some comments on gold's recent action seem appropriate in order to keep it in the proper perspective. Let's look at the Weekly and Daily Charts side by side.

I briefly discuss gold and other indices in my evening Market Summary to subscribers. Recently, I pointed out the positive divergence in the daily chart indicators, which signaled a good bounce from an oversold level. This is the picture given by the daily indicators, but not by the weekly ones, and this is why I feel that a bounce is all this will turn out to be.
According to the P&F chart, GLD has a maximum potential of 160-161 on this run. After that, it will most likely resume its downtrend, possibly meeting its earlier projection to 141-143 in early February. By then, perhaps the weekly indicators will have progressed to a more bullish position.
Note: Because of the present tensions in the Persian Gulf, next week I will discuss oil which, according to the base that was made in 2009, has the capability of going much higher than its current price. If it moves right away toward its objective, it could mean that some sort of an incident will take place in the near future between the US and Iran.
Summary
The second leg of the SPX rally from 1075 started at 1159. It is currently looking for a short-term top, but may not find it until it has pushed a little higher later on in January.
FREE TRIAL SUBSCRIPTON
If precision in market timing for all time frames is something which is important to you, you should consider a trial subscription to my service. It is free, and you will have four weeks to evaluate its worth. It embodies many years of research with the eventual goal of understanding as perfectly as possible how the market functions. I believe that I have achieved this goal.
I can't resist sharing these two subscriber emails that I received recently:
"Hi Andre. I just wanted to thank you for providing the "best" quality service I have ever experienced. I have experienced them all and yours is a "10". You are a great inspiration."
"Dear Andre, I wanted to let you know that I think your service is excellent and want to keep my subscription going. However, I am not sure of its status. Do I owe you any money - if so how much? I don't want to let it lapse."
For a FREE 4-week trial. Send an email to: ajg@cybertrails.com
For further subscription options, payment plans, and for important general information, I encourage you to visit my website at www.marketurningpoints.com. It contains summaries of my background, my investment and trading strategies and my unique method of intra-day communication with subscribers. I have also started an archive of former newsletters.


