


8/1/2012 9:15:35 AM
Jobs surprise...
mathFutures were up ahead of today's payroll report. When the number came out stronger, there were some fluctuations, but for the most part, the biggest reaction was in gold. Gold is still over confident here, as we've been saying:

Obviously if payrolls improve, then the fed is less likely to stimulate. That's bearish for gold. I'll have my forecast for gold below...
Click here to start getting my daily emails today.
The other news on CNBC I find most interesting is that 20 of the last 29 fed days have been positive. Mathematically speaking, if the market is random, then the law of large numbers suggests that this number will revert back to 50/50... Just sayin...
The market is already testing highs from the last 2 days. Again, the key is how the market closes. Expect some gyrations today - as soon as the fed data is resolved, the focus will be on the ECB and BOE.
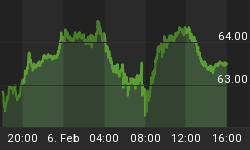
Here's a look at the global markets:

On the economic front, here is the schedule for this week. Pay close attention to the timing of the report and the potential for the markets to make short term reversals at those points.

On to the charts:

Stock Barometer Analysis
We remain in Sell Resistance Mode - the market could be positioning to break out of this consolidation, but we'll require prices to break and hold.
The Stock Barometer is my proprietary market timing system. The direction, slope and level of the Stock Barometer determine our outlook. For example, if the barometer line is moving down, we are in Sell Mode. A Buy or Sell Signal is triggered when the indicator clearly changes direction. Trend and support can override the barometer signals.
Money Management & Stops
To trade this system, there are a few things you need to know and address to control your risk:
• This system targets intermediate term moves, of which even in the best years, there are usually only up to 7 profitable intermediate term moves. The rest of the year will be consolidating moves where this system will experience small losses and gains that offset each other.
• This system will usually result in losing trades more than 50% of the time, even in our best years. The key is being positioned properly for longer term moves when they come.
• Therefore it is vitally important that you apply some form of money management to protect your capital.
• Trading a leveraged index fund will result in more risk, since you cannot set stops and you cannot get out intraday.
Accordingly;
• Make sure you set your stops so that you can lose no more than 2% per trade (based on the QQQQ if you're trading leveraged funds and options with our trading service).
Potential Cycle Reversal Dates
2012 Potential Reversal Dates: 1/12, 1/27, 2/16, 2/23, 3/16, 4/9, 4/25, 5/26. 6/2, 6/15, 7/2, 7/25, 8/13. These dates have an accuracy of +/- 2 days. We publish dates up to 2 months in advance.
This is a critical week, with so much going on economically. But when markets get close to highs, odds are they'll get tested. These tests tell us a lot about the health of a move and for us, whether we can continue higher into 8/13.
Our IRG Market Timing and Sentiment data service shows the performance of these forecast turn dates going back to 2003 and for the remainder of 2012.
My Additional timing work is based on numerous cycles and has resulted in the above potential reversal dates. These are not to be confused with the barometer signals or cycle times. However, due to their past accuracy I post the dates here.
Timing Indicators
Use the following Timing/momentum indicators to assist in your trading of the QQQQ, GLD, USD, USO and TLT. They are tuned to deliver signals in line with the Stock Barometer and we use them only in determining our overall outlook for the market and for pinpointing market reversals. The level, direction, and position to the zero line are keys in these indicators. For example, direction determines mode and a buy signal 'above zero' is more bullish than a buy signal 'below zero'.
QQQ Timing Indicator (NASDAQ:QQQ)

The QQQQ Spread Indicator will yield its own buy and sell signals that may be different from the Stock Barometer. It's meant to give us an idea of the next turn in the market.
Gold Timing Indicator (ARCX:GLD)

Want to trade Gold? Use our signals with the Gold ETF AMEX:GLD. Gold gives us a general gage to the overall health of the US Economy and the markets.
US Dollar Index Timing Indicator (INDEX:DXY)

Want to trade the US Dollar? Use our signals with the Power Shares AMEX:UUP: US Dollar Index Bullish Fund and AMEX:UDN: US Dollar Index Bearish Fund.
Bonds Timing Indicator (AMEX:TLT)

Want to trade Bonds? Use our signals with Lehman?s 20 year ETF AMEX:TLT. The direction of bonds has an impact on the stock market. Normally, as bonds go down, stocks will go up and as bonds go up, stocks will go down.
OIL Timing Indicator (AMEX:USO)

Want to trade OIL? Use our signals with AMEX:USO, the OIL ETF. We look at the price of oil as its level and direction has an impact on the stock market.
Secondary Stock Market Timing Indicator

We maintain hundreds of popular and proprietary technical indicators that break down market internals, sentiment and money flow to give YOU unique insight into whether you should BUY or SELL the market. We feature at least one here each day in support of our current outlook.
As a subscriber to the Daily Stock Barometer System, you also get access to all our charts and research. Email Customer Support at stockbarometer@gmail.com to upgrade your subscription.
Daily Stock Market Outlook
We remain in Sell Mode. The markets continue to test highs.
Our next key reversal date is 8/13 - the only way stocks can continue higher into 8/13 is bonds and the dollar selling off. That will be determined this week. Bonds and the dollar are rallying this am. That should hurt commodities...
Above is the CBOE put call ratio. It's been climbing to relative highs. A little too early to call a significant top in the market, but it's getting closer...
One cue is coming from Gold, which is selling off more significantly this am. It's saying the Fed isn't going to act. Worse case scenario for gold (or best case if you're short like me) is as follows:

Another thing to consider is bonds relationship with stocks:

We've seen this pattern before. A move back towards lows, or a break out will depend on the action in stocks and bonds here. A break above and we'd get very bullish, adding stocks and call options to our portfolio.
And one more thing, the relationship between stocks and the barometer suggests we're close to a reversal lower...

We're thinking of bringing back the Covered Call Alert as part of the Stock Barometer System - if you're interested, or if you trade Covered Calls, email me at jay@stockbarometer.com
Here's our current positioning.
· Last Recommendation - 7/11 - SHORT QQQ
· Status - We're approaching a key reversal date. The markets could move from a short term sell off to a mid term.
· Consideration - Maintain stop per money management above.
If you want to learn more about some of my models and indicators, I use my blog to cover them in more detail. If you're looking for more information, please visit our blog - I'll have updates and publish other articles there.
http://investmentresearchgroup.com/Blog/


