


9/21/2012 9:49:28 AM
Options Expirations
And it's impact on the market.
We're approaching a key reversal date next Tuesday. And as you know, I'm a big believer in reversals aligning with expiration. To support that, I looked back over the past few expirations and put a chart up on the blog (because it's too big to put in this article):
http://investmentresearchgroup.com/Blog/?p=1042
The key is, periodically, expiration can align with reversals.
In addition, the barometer is starting to tick back down. We'll still assume we're in a liquidity advance before moving into Sell Mode. Which means we'll need to see bearish closing price action. A sign of weakness.
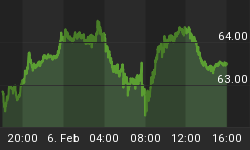
Here's a look at the global stock markets:

On the economic front, here is the schedule for this week. Pay close attention to the timing of the report and the potential for the markets to make short term reversals at those points.

On to the charts:

Stock Barometer Analysis
The barometer remains in Buy Mode. We're looking for a move higher into 9/25.
The Stock Barometer is my proprietary market timing system. The direction, slope and level of the Stock Barometer determine our outlook. For example, if the barometer line is moving down, we are in Sell Mode. A Buy or Sell Signal is triggered when the indicator clearly changes direction. Trend and support can override the barometer signals.
Money Management & Stops
To trade this system, there are a few things you need to know and address to control your risk:
• This system targets intermediate term moves, of which even in the best years, there are usually only up to 7 profitable intermediate term moves. The rest of the year will be consolidating moves where this system will experience small losses and gains that offset each other.
• This system will usually result in losing trades more than 50% of the time, even in our best years. The key is being positioned properly for longer term moves when they come.
• Therefore it is vitally important that you apply some form of money management to protect your capital.
• Trading a leveraged index fund will result in more risk, since you cannot set stops and you cannot get out intraday.
Accordingly;
• Make sure you set your stops so that you can lose no more than 2% per trade (based on the QQQQ if you're trading leveraged funds and options with our trading service).
Potential Cycle Reversal Dates
2012 Potential Reversal Dates: 1/12, 1/27, 2/16, 2/23, 3/16, 4/9, 4/25, 5/26. 6/2, 6/15, 7/2, 7/25, 8/13, 8/30, 9/8, 9/25. These dates have an accuracy of +/- 2 days. We publish dates up to 2 months in advance.
The market is breaking out of a large consolidation pattern, which has us bullish into 9/25 and possibly beyond. We'll be at a re-evaluation point next week.
Our IRG Market Timing and Sentiment data service shows the performance ofthese forecast turn dates going back to 2003 and for the remainder of 2012.
My Additional timing work is based on numerous cycles and has resulted in the above potential reversal dates. These are not to be confused with the barometer signals or cycle times. However, due to their past accuracy I post the dates here.
Timing Indicators
Use the following Timing/momentum indicators to assist in your trading of the QQQQ, GLD, USD, USO and TLT. They are tuned to deliver signals in line with the Stock Barometer and we use them only in determining our overall outlook for the market and for pinpointing market reversals. The level, direction, and position to the zero line are keys in these indicators. For example, direction determines mode and a buy signal 'above zero' is more bullish than a buy signal 'below zero'.
QQQ Timing Indicator (NASDAQ:QQQ)

The QQQQ Spread Indicator will yield its own buy and sell signals that may be different from the Stock Barometer. It's meant to give us an idea of the next turn in the market.
Gold Timing Indicator (ARCX:GLD)

Want to trade Gold? Use our signals with the Gold ETF AMEX:GLD. Gold gives us a general gage to the overall health of the US Economy and the markets.
US Dollar Index Timing Indicator (INDEX:DXY)

Want to trade the US Dollar? Use our signals with the Power Shares AMEX:UUP: US Dollar Index Bullish Fund and AMEX:UDN: US Dollar Index Bearish Fund.
Bonds Timing Indicator (AMEX:TLT)

Want to trade Bonds? Use our signals with Lehman?s 20 year ETF AMEX:TLT. The direction of bonds has an impact on the stock market. Normally, as bonds go down, stocks will go up and as bonds go up, stocks will go down.
OIL Timing Indicator (AMEX:USO)

Want to trade OIL? Use our signals with AMEX:USO, the OIL ETF. We look at the price of oil as its level and direction has an impact on the stock market.
Secondary Stock Market Timing Indicator

We maintain hundreds of popular and proprietary technical indicators that break down market internals, sentiment and money flow to give YOU unique insight into whether you should BUY or SELL the market. We feature at least one here each day in support of our current outlook.
As a subscriber to the Daily Stock Barometer System, you also get access to all our charts and research. Email Customer Support at stockbarometer@gmail.com to upgrade your subscription.
Daily Stock Market Outlook
We remain in Buy Mode, looking for the markets moving higher into 9/25.
Above is a chart of the nasdaq advancing stocks. It's been pulling back, but not to a bearish level. That would be a state change in the market if we were to get a larger sell off. So far we're not seeing it. So we remain bullish.
Here's another chart to consider:
I'm a big believer that the market likes to suck people in at tops before the market goes lower. So I look at money flow as a measure of euphoria - or complacency. We're seeing excessively high readings of money flow at this point:

Now the counter argument is that money flowing into stocks lifts stocks. I'd agree, but if you look at the over all quantity/value of the market and then compare it to what's flowing in and out - it's much like filling or emptying a bath tub with a thimble. That makes money flow a contrary measure...
I always talk about focus. In trading, your focus should always be on the next trade. Once you make your trade, set your stops, you current trade is basically set. I'm focused on that next Tuesday as a potential reversal. That's why I haven't pushed us into a lot of call options or into more stocks than we're already in.
Here's our current positioning.
· Last Recommendation - 9/14 - LONG QQQ
· Status - Initial trades are at the highest risk.
· Consideration - Always maintain stops per money management above.
Regards,
If you want to participate in our Social Media experience, please visit and "LIKE" our FaceBook page. I'll have periodic updates on there and I WANT your feedback. This will be a good way to share your views with othertraders.
If you want to learn more about some of my models and indicators, I use my blog to cover them in more detail. If you're looking for more information, please visit our blog - I'll have updates and publish other articles there.


