

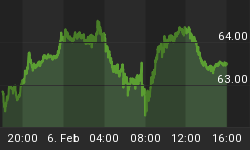


I begin today's brief technical update with a look at the EUR, which is down 7 out of the last 8 trading days. Yesterday it bounced off the important 200 d MA = 1.2823 & 20 d MA leaving in the chart a bullish Hammer. Therefore price could attempt to carry out a multi-day bounce, which I consider as an "oversold rebound".
The resistance to watch is at 1.3000.
If EUR rebounds then the equity market should follow the currency move.

Let's now go to the SPX charts.
Yesterday I mentioned that in the range 1440 - 1435 price could have attempted to establish a short-term bottom.
Why?
Because the 20 d MA was standing at 1436 and at 1435 we have the previous wave (4) and also we had the FOMC QE3 launch of an "exhaustion" thrust up.
But the daily candlestick does not give much confidence that such a bottom is in place.
Therefore today we have to watch the EUR closely.
In the daily chart below we can see that the range 1429 - 1422 has to hold otherwise there is only thin air until the rising trend line in force since the June 4 low.
Above yesterday`s eod print we now have the 20 d MA = 1438 then the 3 d MA = 1444, which has to be recovered in order for price to attempt a multi-day rebound.
The previous pivot support at 1450 is now the major resistance.

As I mentioned yesterday: "price should be now involved in the initial stage of a pull back that should grow in size but it should not endanger the intermediate up trend."
Therefore I expect more downside price action ahead.
Lets now analyze the short-term price action, which so far can be labeled as a Double Zig Zag.
Despite the daily candlestick is "neutral" the short term count is suggesting the price could have established the bottom of the wave (Y), but we have to proceed with caution since corrective patterns can easily morph, so we have the immediate time frame picture not clear.
If a short-term bottom is in place then the strength of the bounce will help us define the correct EWP. At the moment I can say that if we are dealing with a wave (2) or (X) then price should not achieve an eod print above 1450, while if price is unfolding a wave (B) then it should top in the range of the 0.618 retracement = 1458.

In the technical front:
- Daily RSI has reached the 50 line (possible short term pause?), but the sharp drop suggests that strong down side momentum is in play.

- We have a positive divergence of the NYSE Adv-Dec Volume, which strengthen the option of a short-term bounce.


