


We're getting close, but no cigar.
Thursday was good start for the bulls, but a better end for the bears. In Japanese terms, they call this a last engulfing, which can be a sign of a bottom, even in the short term. Again more so on the Qs than on the SPY.
I still haven't seen a capitulation level in selling - so while we may be working on a short term bottomm, I'd be cautious here because we're at a point where the markets should have had some bearish signals. Instead, the market still seems somewhat optimistic. Lack of fear is a bad thing as a market moves lower.
So while momentum is set up for a strong open, watch to see what the market does as the day goes on. That will be the real tell...
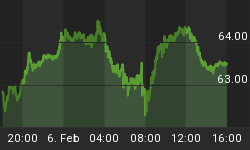
Here's a look at the global stock markets:

On the economic front, here is the schedule for this week. Pay close attention to the timing of the report and the potential for the markets to make short term reversals at those points.

On to the charts:

Stock Barometer Analysis
The barometer remains in Sell Mode, we're looking for the markes to move lower into October 30th.
The Stock Barometer is my proprietary market timing system. The direction, slope and level of the Stock Barometer determine our outlook. For example, if the barometer line is moving down, we are in Sell Mode. A Buy or Sell Signal is triggered when the indicator clearly changes direction. Trend and support can override the barometer signals.
Money Management & Stops
To trade this system, there are a few things you need to know and address to control your risk:
• This system targets intermediate term moves, of which even in the best years, there are usually only up to 7 profitable intermediate term moves. The rest of the year will be consolidating moves where this system will experience small losses and gains that offset each other.
• This system will usually result in losing trades more than 50% of the time, even in our best years. The key is being positioned properly for longer term moves when they come.
• Therefore it is vitally important that you apply some form of money management to protect your capital.
• Trading a leveraged index fund will result in more risk, since you cannot set stops and you cannot get out intraday.
Accordingly;
• Make sure you set your stops so that you can lose no more than 2% per trade (based on the QQQQ if you're trading leveraged funds and options with our trading service).
Potential Cycle Reversal Dates
2012 Potential Reversal Dates: 1/12, 1/27, 2/16, 2/23, 3/16, 4/9, 4/25, 5/26. 6/2, 6/15, 7/2, 7/25, 8/13, 8/30, 9/8, 9/25, 10/7, 10/30, 11/15. These dates have an accuracy of +/- 2 days. We publish dates up to 2 months in advance.
With a bounce into 10/7, we're looking for markets to move lower into 10/30.
Our IRG Market Timing and Sentiment data service shows the performance ofthese forecast turn dates going back to 2003 and for the remainder of 2012.
My Additional timing work is based on numerous cycles and has resulted in the above potential reversal dates. These are not to be confused with the barometer signals or cycle times. However, due to their past accuracy I post the dates here.
Timing Indicators
Use the following Timing/momentum indicators to assist in your trading of the QQQQ, GLD, USD, USO and TLT. They are tuned to deliver signals in line with the Stock Barometer and we use them only in determining our overall outlook for the market and for pinpointing market reversals. The level, direction, and position to the zero line are keys in these indicators. For example, direction determines mode and a buy signal 'above zero' is more bullish than a buy signal 'below zero'.
QQQ Timing Indicator (NASDAQ:QQQ)

The QQQQ Spread Indicator will yield its own buy and sell signals that may be different from the Stock Barometer. It's meant to give us an idea of the next turn in the market.
Gold Timing Indicator (ARCX:GLD)

Want to trade Gold? Use our signals with the Gold ETF AMEX:GLD. Gold gives us a general gage to the overall health of the US Economy and the markets.
US Dollar Index Timing Indicator (INDEX:DXY)

Want to trade the US Dollar? Use our signals with the Power Shares AMEX:UUP: US Dollar Index Bullish Fund and AMEX:UDN: US Dollar Index Bearish Fund.
Bonds Timing Indicator (AMEX:TLT)

Want to trade Bonds? Use our signals with Lehman?s 20 year ETF AMEX:TLT. The direction of bonds has an impact on the stock market. Normally, as bonds go down, stocks will go up and as bonds go up, stocks will go down.
OIL Timing Indicator (AMEX:USO)

Want to trade OIL? Use our signals with AMEX:USO, the OIL ETF. We look at the price of oil as its level and direction has an impact on the stock market.
Secondary Stock Market Timing Indicator

We maintain hundreds of popular and proprietary technical indicators that break down market internals, sentiment and money flow to give YOU unique insight into whether you should BUY or SELL the market. We feature at least one here each day in support of our current outlook.
As a subscriber to the Daily Stock Barometer System, you also get access to all our charts and research. Email Customer Support at stockbarometer@gmail.com to upgrade your subscription.
Daily Stock Market Outlook
We remain in Sell Mode, now looking for a move lower into 10/30. Markets are in a downtrend and testing the 9/26 lows for the SPY and already broken the 9/26 lows on the Qs. If selling picks up on the NYSE, which I expect, the Qs will be taken down with it...
As we said yesterday, the key is how this market is closing, and Thursday's gap up open, was retraced for a lower close. That's bearish.
The above chart shows the Mclellan Oscillator - which is very low, which on one hand is a bearish sign, but on a contrary basis, it's beginning to get bullish. The signal can come a little early. And a large sell off can still commence. You never know what you're going to get...
A few more things to chew on:
The EPCR below is a measure of fear. Relatively speaking, the level is not low enough for me to believe we've seen a bottom.

On Natural Gas, we're still looking at that channel, but option writers are starting to prep for more downside as they did before the last top...

If bonds turn higher here, which I think they will, the Qs will take another hit lower.

This pattern of the SPY and Bonds is also bearish. And suggests to me lower prices to come.

It's a Friday, and markets have been weak. We've seen more selling into the close over the past 5 days. That leads me to think we're not done. And while next Friday is options expiration, which can lead to some pinning action, we still see a final bottom potential of 10/30.
If you want to participate in our Social Media experience, please visit and "LIKE" our FaceBook page. I'll have periodic updates on there and I WANT your feedback. This will be a good way to share your views with other traders. http://www.facebook.com/InvestmentResearchGroupInc
Here's our current positioning.
· Last Recommendation - 9/25am - SHORT QQQ
· Status - Initial trades are at the highest risk.
· Consideration - Always maintain stops per money management above.
If you want to learn more about some of my models and indicators, I use my blog to cover them in more detail. If you're looking for more information, please visit our blog - I'll have updates and publish other articles there. http://investmentresearchgroup.com/Blog/
Regards,


