


After the close on Monday, the markets received some good news from Europe. It appears the expected deal to once again "save Greece" is in place. From the Washington Post:
Euro-zone finance ministers and the International Monetary Fund clinched agreement on a new debt target for Greece on Monday in a breakthrough toward releasing an urgently needed tranche of loans to the near-bankrupt economy, officials said.
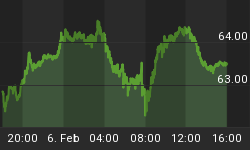
Partly due to expectations of a deal in Greece, markets have stabilized over the past five trading sessions. As shown below, the NASDAQ held at the lower end of a weekly trend channel formed by lines A & B. Williams %R, used to monitor market momentum, has improved in a manner similar to early June.

The primary driver of the recent shift back toward risk-on was the fiscal cliff press conference held on Friday, November 16. Since then, technology stocks have led the push higher. Last week, the NASDAQ ETF (QQQ) cleared the downward sloping blue trendline on the right side of the chart below. Notice a similar break occurred near the June 2012 low in stocks. A popular momentum indicator, MACD, experienced a bullish cross last week similar to the one that occurred at the summer low (see bottom of chart).

The real test for the bulls will come when the almost inevitable "bad news" starts to surface related to difficult cliff negotiations. The tone of the Sunday talk shows hinted that the road to compromise could be difficult at best. From Reuters:
Republicans in the U.S. Congress on Monday called on President Barack Obama to detail long-term spending cuts to help solve the country's fiscal crisis, while holding firm against the income tax rate increases for the wealthy that Democrats seek.The White House has been equally firm in its position, threatening to veto any bill that does not include the tax rate increases opposed by Republicans.
Our weekly technical review of the markets shows a mixed bag. From a bullish perspective the technicals have improved noticeably. Concerns remain relative to possible "trend exhaustion" as measured by DeMark counts and long-term resistance for European stocks. This week's video contains:
- A risk-on vs. risk-off analysis using a weekly chart of S&P 500 longs vs. S&P 500 shorts (SPY/SH at 01:26 mark).
- An inflation vs. deflation analysis using a daily chart of silver relative to long-term Treasuries (SLV/TLT at 04:14).
- Discernible bullish progress on the daily chart of the S&P 500 Index (06:51).
- Possible weekly resistance for the S&P 500 (08:29).
- Long-term resistance for German stocks ($DAX at 09:16 mark).
- DeMark count and indicators for Euro Stoxx 50 (FEZ at 09:53 mark).
- S&P 500 daily DeMark count and indicators (11:47).
of the video player to view in full-screen mode. Hit Esc to exit full-screen mode.
As shown below, the broader S&P 500 Index has also seen improvement from a technical perspective.

On November 16 we postulated the markets were positioned for a rally attempt. Last week the rally did indeed transpire. Our approach has been to scale back into risk assets primarily via the beat-up technology sector. If the markets can continue to digest developments in Europe and Washington, D.C. in a fairly positive manner, we will continue to reduce our cash position by "buying low".


