


The good news is:
• When this current period of weakness ends, the market will be freeto rise again.
Little changed in the past week; new lows continued rise and new highs continued to decline.
The first chart shows the NASDAQ composite (OTC) in red, a 10% trend (19 day EMA) of NASDAQ new highs in green and a 10% trend of NASDAQ new lows in blue. The new low indicator has been plotted on an inverted Y axis so when new lows are increasing the line moves downward and when new lows are decreasing the indicator moves upward.
At this time the new low indicator is the only one you need to watch.
When this decline ends, new lows will diminish quickly sending the indicator sharply upward similar to last August which is showing on the left side of the chart.
At this point there is no hint that the current decline is over.

The next chart shows the same indicators using NYSE data.
The S&P 500 (SPX) is in red, new high indicator in green and the new low indicator in brown.
The patterns are similar.

Over bought, over sold is a nebulous concept. The issues are time and magnitude.
The chart below deals with time.
The Russell 2000 (R2K) is shown in red while the green line shows the percentage of the previous 6 trading days that have been up. For the last 2 weeks there has been no more than 1 or 2 up days out of the preceding 6. The worst since late July and August.

Seasonally the last 4 trading days of March are mixed.
The period is better than average during the 1st year of the presidential cycle, but the average is not impressive.
Overall the OTC has been up 60% of the time with an average gain of only .09% while the SPX has been up 51% of the time with an average loss of 0.13%.
Breaking it down by year of the presidential cycle the NASDAQ has been up 70% of the time with an average gain of 0.29% and the SPX has been up 68% of the time with an average gain of 0.07%
Report for the last 4 days of March.
The number following the daily return represents the day of the week;
1 = Monday, 2 = Tuesday etc.
MDD = Maximum Draw Down
| Presidential year 1 (OTC) | |||||
| OTC | Day4 | Day3 | Day2 | Day1 | Totals |
| 1965-1 | -0.14% 5 | -0.33% 1 | -0.02% 2 | 0.10% 3 | -0.39% |
| 1969-1 | -0.10% 2 | -0.29% 3 | 0.15% 4 | 0.34% 5 | 0.09% |
| 1973-1 | 1.17% 2 | 0.21% 3 | 0.90% 4 | -0.62% 5 | 1.66% |
| 1977-1 | -0.45% 1 | 0.07% 2 | -0.73% 3 | -0.11% 4 | -1.21% |
| 1981-1 | 0.11% 4 | -0.34% 5 | 0.07% 1 | 0.58% 2 | 0.42% |
| Avg | 0.11% | -0.13% | 0.07% | 0.06% | 0.11% |
| 1985-1 | -0.03% 2 | 0.50% 3 | 0.22% 4 | 0.37% 5 | 1.06% |
| 1989-1 | 0.51% 2 | 0.27% 3 | 0.21% 4 | 0.54% 5 | 1.53% |
| 1993-1 | 0.08% 5 | -0.11% 1 | 0.81% 2 | 0.57% 3 | 1.34% |
| 1997-1 | 0.44% 2 | 1.68% 3 | -1.54% 4 | -2.22% 1 | -1.64% |
| 2001-1 | 2.80% 2 | -2.00% 3 | -1.81% 4 | 1.08% 5 | 0.08% |
| Avg | 0.76% | 0.07% | -0.42% | 0.07% | 0.47% |
| Averages | 0.44% | -0.03% | -0.18% | 0.06% | 0.29% |
| % Winners | 60% | 50% | 60% | 70% | 70% |
| MDD 3/29/2001 3.77% -- 3/31/1997 3.73% -- 3/31/1977 1.21% | |||||
| Summary of all years 1963 - 2004 (OTC) | |||||
| Averages | -0.01% | 0.05% | -0.08% | 0.13% | 0.09% |
| % Winners | 52% | 60% | 55% | 66% | 60% |
| MDD 3/30/2000 10.10% -- 3/31/1994 5.10% -- 3/29/2001 3.77% | |||||
| Presidential year 1 (SPX) | |||||
| SPX | Day4 | Day3 | Day2 | Day1 | Totals |
| 1929-1 | -2.78% 1 | -0.65% 2 | 3.04% 3 | 1.75% 4 | 1.36% |
| 1933-1 | 1.97% 2 | -2.25% 3 | -0.33% 4 | -3.31% 5 | -3.92% |
| 1937-1 | 0.40% 6 | -0.68% 1 | 1.82% 2 | -0.17% 3 | 1.37% |
| 1941-1 | 0.81% 4 | -0.70% 5 | -0.20% 6 | 0.40% 1 | 0.31% |
| 1945-1 | 0.60% 2 | 0.82% 3 | 0.22% 4 | 0.22% 6 | 1.86% |
| 1949-1 | 0.27% 1 | 1.94% 2 | -0.07% 3 | -0.99% 4 | 1.16% |
| 1953-1 | -0.57% 4 | 0.15% 5 | -1.46% 1 | -1.25% 2 | -3.13% |
| 1957-1 | 0.07% 2 | 0.41% 3 | 0.20% 4 | -0.16% 5 | 0.52% |
| 1961-1 | -0.11% 1 | 0.05% 2 | 0.85% 3 | 0.20% 4 | 0.99% |
| Avg | 0.05% | 0.67% | -0.05% | -0.39% | 0.28% |
| 1965-1 | -0.74% 5 | -0.20% 1 | 0.20% 2 | -0.05% 3 | -0.78% |
| 1969-1 | 0.16% 2 | 0.73% 3 | 0.71% 4 | 0.41% 5 | 2.01% |
| 1973-1 | 1.57% 2 | 0.05% 3 | 0.98% 4 | -1.06% 5 | 1.54% |
| 1977-1 | -0.06% 1 | 0.70% 2 | -1.15% 3 | -0.12% 4 | -0.64% |
| 1981-1 | -0.61% 4 | -1.19% 5 | -0.27% 1 | 1.28% 2 | -0.80% |
| Avg | 0.06% | 0.02% | 0.09% | 0.09% | 0.27% |
| 1985-1 | 0.26% 2 | 0.62% 3 | 0.00% 4 | 0.62% 5 | 1.50% |
| 1989-1 | 0.35% 2 | 0.26% 3 | 0.06% 4 | 0.80% 5 | 1.47% |
| 1993-1 | -0.69% 5 | 0.67% 1 | 0.27% 2 | -0.07% 3 | 0.18% |
| 1997-1 | -0.23% 2 | 0.18% 3 | -2.10% 4 | -2.17% 1 | -4.32% |
| 2001-1 | 2.56% 2 | -2.44% 3 | -0.46% 4 | 1.08% 5 | 0.73% |
| Avg | 0.45% | -0.14% | -0.45% | 0.05% | -0.09% |
| Averages | 0.17% | -0.08% | 0.12% | -0.13% | 0.07% |
| % Winners | 58% | 63% | 53% | 47% | 68% |
| MDD 3/31/1933 5.80% -- 3/31/1997 4.27% -- 3/26/1929 3.41% | |||||
| Summary of all years 1928 - 2004 (SPX) | |||||
| Averages | -0.02% | 0.02% | -0.02% | -0.12% | -0.13% |
| % Winners | 49% | 54% | 44% | 43% | 51% |
| MDD 3/31/1939 8.42% -- 3/31/1933 5.80% -- 3/30/1931 5.02% | |||||
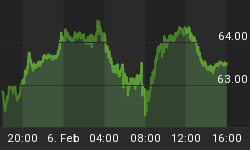
The prettiest chart I saw this week. Not everything has been down, the chart below shows an index of nine railroad issues in red and summation indices of oscillators of advancing - declining issues, new highs - new lows and upside - downside volume. The average hit a new high last week and the summation indices are all heading upward.

There is no evidence of a bottom, but over the past 3 weeks the major indices are down between 4% and 5% (an annualized rate of about 80%) making the market over sold.
I expect the major indices to be higher on Thursday March 18 than they were on Thursday March 24.
My expectation of a low on Monday or Tuesday last week came on Thursday, too late for my optimistic forecast of an up week.


