


12/12/2012 8:55:47 AM
We remain bullish...
All systems are about to get set off as the stage is set to move into a liquidity advance. Bonds are about to sell off and test lows, and in the process, we'll see a large advance in the stock market. So if you're not positioned long, you'll miss out.
That being said, our financial system is always subject to random shocks. For example, no one knows if the fiscal cliff will get resolved and if it does, when it will get resolved. And no one knows how the market will respond if and when it happens. My guess is that we won't see a resolution until 2013. And when we do, markets will adjust.
It's one of the reason I'm seeing a bearish start to the markets in 2013. I've started working on my 2013 forecast and you can find it in our NYSE Indicator page.
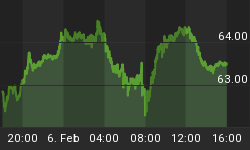
Here's a look at the global stock markets:

On the economic front, here is the schedule for this week. Pay close attention to the timing of the report and the potential for the markets to make short term reversals at those points.

On to the charts:

Stock Barometer Analysis
We remain in Buy Mode, looking for an advance into December 17th. The barometer returned back to normal as we projected and suggests the markets can go much higher from here...
The Stock Barometer is my proprietary market timing system. The direction, slope and level of the Stock Barometer determine our outlook. For example, if the barometer line is moving down, we are in Sell Mode. A Buy or Sell Signal is triggered when the indicator clearly changes direction. Trend and support can override the barometer signals.
Money Management & Stops
To trade this system, there are a few things you need to know and address to control your risk:
• This system targets intermediate term moves, of which even in the best years, there are usually only up to 7 profitable intermediate term moves. The rest of the year will be consolidating moves where this system will experience small losses and gains that offset each other.
• This system will usually result in losing trades more than 50% of the time, even in our best years. The key is being positioned properly for longer term moves when they come.
• Therefore it is vitally important that you apply some form of money management to protect your capital.
• Trading a leveraged index fund will result in more risk, since you cannot set stops and you cannot get out intraday.
Accordingly;
• Make sure you set your stops so that you can lose no more than 2% per trade (based on the QQQQ if you're trading leveraged funds and options with our trading service).
Potential Cycle Key Reversal Dates
2012 Potential Reversal Dates: 1/12, 1/27, 2/16, 2/23, 3/16, 4/9, 4/25, 5/26. 6/2, 6/15, 7/2, 7/25, 8/13, 8/30, 9/8, 9/25, 10/7, 10/30, 11/15, 12/17, 1/15/13. These dates have an accuracy of +/- 2 days. We publish dates up to 2 months in advance.
We have a confirmed 11/15 bottom that would project a move higher into 12/17. Following 12/17, I see a fiscal cliff nose dive into January... However, I want to add this. If we go into Liquidity mode, then markets will move higher into Mid January...
We're starting to do our review of 2013, where we should see 2 really large moves. I'm leaning towards a bearish first half of 2013, with a very bullish second half... So stay tuned...
Our IRG Market Timing and Sentiment data service shows the performance of these forecast turn dates going back to 2003 and for the remainder of 2012.
My Additional timing work is based on numerous cycles and has resulted in the above potential reversal dates. These are not to be confused with the barometer signals or cycle times. However, due to their past accuracy I post the dates here.
Timing Indicators
Use the following Timing/momentum indicators to assist in your trading of the QQQQ, GLD, USD, USO and TLT. They are tuned to deliver signals in line with the Stock Barometer and we use them only in determining our overall outlook for the market and for pinpointing market reversals. The level, direction, and position to the zero line are keys in these indicators. For example, direction determines mode and a buy signal 'above zero' is more bullish than a buy signal 'below zero'.
QQQ Timing Indicator (NASDAQ:QQQ)

The QQQQ Spread Indicator will yield its own buy and sell signals that may be different from the Stock Barometer. It's meant to give us an idea of the next turn in the market.
Gold Timing Indicator (ARCX:GLD)

Want to trade Gold? Use our signals with the Gold ETF AMEX:GLD. Gold gives us a general gage to the overall health of the US Economy and the markets.
US Dollar Index Timing Indicator (INDEX:DXY)

Want to trade the US Dollar? Use our signals with the Power Shares AMEX:UUP: US Dollar Index Bullish Fund and AMEX:UDN: US Dollar Index Bearish Fund.
Bonds Timing Indicator (AMEX:TLT)

Want to trade Bonds? Use our signals with Lehman?s 20 year ETF AMEX:TLT. The direction of bonds has an impact on the stock market. Normally, as bonds go down, stocks will go up and as bonds go up, stocks will go down.
OIL Timing Indicator (AMEX:USO)

Want to trade OIL? Use our signals with AMEX:USO, the OIL ETF. We look at the price of oil as its level and direction has an impact on the stock market.
Secondary Stock Market Timing Indicator

We maintain hundreds of popular and proprietary technical indicators that break down market internals, sentiment and money flow to give YOU unique insight into whether you should BUY or SELL the market. We feature at least one here each day in support of our current outlook.
As a subscriber to ANY Stock Barometer Newsletter, you also get access to all our charts and research.
Daily Stock Market Outlook
We remain in Buy Mode, expecting the markets to move higher into 12/17.
I've been talking about the divergence in the SPY/QQQ. The second part of that is that we should see money flow back into the Nasdaq at some point. This fed meeting is key for action in dollar and bonds. This could be the driver of that change...
Above is a chart of Nasdaq Cumulative Breadth. The pattern is mid term bullish.
Overbought markets that remains strong is a sign of a liquidity advance. As seen below in the TRIN, this is about as good as it gets...

Word of caution, a fed meeting is a decision point. First, traders will act on what the market does. Tomorrow, institutions may act on what the fed says. So a weak day today doesn't mean as much as what we see happen tomorrow.
If you want to participate in our Social Media experience, please visit and "LIKE" our FaceBook page. I'll have periodic updates on there and I WANT your feedback. This will be a good way to share your views with other traders. http://www.facebook.com/InvestmentResearchGroupInc
How have we been doing?

Not too shabby... Plus what you don't see here is the performance of the long stock portfolio (V and AMT continue to rally!) and our SOS put options (i.e. we recommended put options on the Apple decline) and our call options recommended on 11/20. It's all part of the DSB system...
Here's our current positioning.
• Last Recommendation - 11/19 long at open at 62.97
• Status - As with any new positions, this is where risk management is critical.
• Consideration - Always maintain stops per money management above. Once you have established a gain in a position, there is nothing wrong with taking some profits early...
If you want to learn more about some of my models and indicators, I use my blog to cover them in more detail. If you're looking for more information, please visit our blog - I'll have updates and publish other articles there. http://investmentresearchgroup.com/Blog/
Regards,


