

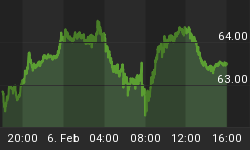


If I show you the following daily momentum indicator chart without telling you to which asset it belongs what would you think regarding the overall strength of the underlying instrument?

I don't know your answer is but I would say that it is involved in a downtrend and due to yesterday's stochastic bullish cross it may begin a countertrend bounce.
WRONG!!!
The chart above belongs to the DOW and yesterday it achieved a new higher high and the eod print is only 122.73 points below the all time high (2007 Top).

I am not going to blame it to conspiracy theories although it is obvious that the only reason why the US equity market has not began an healthy correction is because Bernanke does not want one.
So despite all the technical reasons I have been discussing (Momentum and breadth negative divergences and sell signals) and despite SPX initial lower high/low sequence off the February peak was clearly suggesting that a correction was already underway yesterday's new high of the DOW probably has distorted the natural path that price should have carried out.
I was annoyed by the disparity of the potential EWP that DOW and SPX were forming but I have to admit that I was not expecting yesterday bullish event.
So now even though SPX has not achieved a higher high I lost the confidence that November - February up leg is over.
Lets go to the charts:
It would be easier to consider that from the November lows the DOW yesterday has began the final wave (5):

But I am sorry, EW wise an overlapping price structure cannot be considered impulsive, instead in my opinion at the February 20 peak, price with an Ending Diagonal completed a Double ZZ. Now if price has resumed the up trend then the Double Zig Zag will have morphed into a Triple Zig Zag:

Within this scenario which options could pan out?
- Last Tuesday price has began the wave (Z); Blue count.
- On February 20 price has completed the November-February up leg and a complex and freakish Zig Zag is already underway, in which case price is now completing the wave (B); Black count. (This is probably "creative counting")

For the immediate time frame, with the help of a bizarre Expanded Leading Diagonal, price should be now in the wave (III) of (3) hence this up leg should not be over yet.

Lets move to SPX.
The pattern (Double Zig Zag) that can justify that a correction has been kicked off is still valid. The up leg off last Tuesday's lod can still be a wave (X) as long as price does not break above 1525.84.
In the next few days we shall see if bulls are able to break above the trend line resistance that connects the February high with the lower high established on Monday. If 1525 goes then I will have to adopt the same count as discussed above for the DOW.

In the technical front:
- The McClellan Oscillator, despite the huge negative divergence, yesterday the stochastic has issued a buy signal (It has a lot of room to the upside before entering the overbought zone). So this initial thrust higher could propel the equity market much higher if the zero line is reclaimed.

- Momentum indicators remain aligned with a corrective scenario. The Stochastic will probably set the pace of the trend higher or lower depending upon if it issues a bullish cross or not.

Lastly, a look at the VIX.
Tuesday's Harami was suggesting a pullback; in addition of a buy equity Bollinger Band signal.
Now we have wait to see if it is just a pullback, in which case VIX has to establish a bottom in the range of the 20 d ma - last Monday's low (Yesterday the trend line off the February 19 has deterred further weakness).
If the RSI loses the 50 line than the probability of a move back to the February 19 low will substantially increase.


