

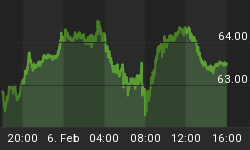


TECHNICALS ARE DISREGARDED WHILE SPX IS AIMING AT 1576
We have increasing evidence that the up leg form the February 26 low is getting overstretched but we also have bullish signals from the daily MACD, the Summation Index and Sentiment that are suggesting that the up leg from the November lows will not be fully retraced in the near future (No major reversal in sight).
Below I have a few comments in the SPX daily momentum chart:

We still do not have extreme bullish readings of the Put/Call ratio or an eod spike of TICK - plunge of TRIN. Neither an ending pattern can be considered completed.
We do have a few warnings:
- Negative divergence of the NYSE Adv-Dec Volume:

- Negative divergence of the McClellan Oscillator (Yesterday's lower high vs higher high of SPX).

- Weekly stochastic has issued a bearish cross at the end of February.
Lets move on to the SPX charts.
Daily time frame:
- I maintain unchanged the count from the November 16 low = Triple Zig Zag.
- This means that price is now "finishing" the wave (A) of the third Zig Zag.
- I don't expect the following wave (B) pullback to break down the previous break out at 1530.94 (If it does the 20 d ma will most likely deter a larger decline).
- The following wave (Z) up will most likely have the mission to forcefully break through the all time high at 1576.
- In this last up leg we should see negative divergences and a buying exhaustion.

Once the pattern from the November lows is complete DO NOT EXPECT A MAJOR REVERSAL.
Why:
-
A corrective up lag cannot establish the end of an EWP.
-
Weekly RSI should be showing a negative divergence.

Short-term time frame:
Regarding the internal count of the up leg from the February 26 low (Assumed wave A) I believe that it is unfolding a Triple Zig Zag.
I have a confident count up to the March 6 eod print, since a Triangle should have established the wave (X). But the following upside move has unfolded an overlapping mess, maybe we are still in the wave (A) of the third Zig Zag. Therefore at the moment what I can say is that only a move back below yesterday's lod at 1539.90 would suggest that the wave (B) pullback could be in progress.

Yesterday VIX erased the divergence vs SPX by dropping 8.18%. I have no idea where it will establish a short-term bottom (The all time low is at 9.31 established on December 1993, which was retested on November 2006 (9.38).
The positive divergence of the RSI has been cancelled (hence a sustainable bottom is not probable anymore) so I am hoping (For the sake of having a working pattern) that at the bottom wherever it is, it will allow to draw a converging pattern.

We have two major event risks coming upon us: Quarterly Opex next Friday and FOMC the following week on Wednesday. So time is running out for a short-term pullback this week as I don't expect weakness ahead of Bernanke's press conference.


