


For the week ending March 29, 2013, the SPX was up 0.8%, the Russell small caps were up 0.6% and the COMP was up 0.7%.
Though the S&P 500 has now closed at an all time high all indices remain flat and in a confluence zone per the model. Price may still push higher but there are some very clear and troublesome divergences within credit and foreign currency markets. These divergences are beyond the many others such as EURUSD, AUDUSD, copper and oil futures, Treasury yield and more.
The question of the ability to sustain current equity prices remains a valid concern based on both technicals and position data. Recent COT data is a complete inverse of August 2011 though more extreme as commercial is positioned for a trend reversal while non-commercial is essentially all in to the long side. This would also debunk the myth about cash on the sidelines and many waiting to go long. The data would support the contrary.
Within FX, the most important and noticeable divergence remains with JPY both futures and pairs which over the past few weeks have trended in a risk off direction.
Asset Class Correlations
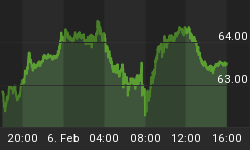
For the week ending March 29, 2013, the DXY was up 0.8%, 30 year yield was down 4bp and the USD/JPY was down 0.3%.
The commodity sector was mixed with DBC up 0.6%, oil up 3.8% and copper down 2.1% and signaled short on the daily chart. Agriculture futures sold off hard on Friday including corn closing limit down, wheat down 6.5% and soybeans down 3.4%.
The model remains flat USD/JPY, long DXY and short EUR/USD. The current DXY profile is showing clear momentum loss while JPY is very close to a trend reversal.
The multi-month divergence with equity and the EUR, copper and 30 year yield remains. As a result equity may show greater relative weakness as part of any future asset class convergence. Using any of these asset classes as a directional indicator may likely produce false signals. Our preference is to use JPY pairs.
This week saw a continuation of the divergence with 5 year Treasury break evens which were up 1bp on the week.


Sentiment
After a 20% rise in volatility the prior week, this week the VIX pulled back slightly, down 3.4%. Implied volatility skew remains high though has come in over the prior week, averaging 122.35 for the week and closing at 122.93. There is currently a wide divergence and prior moves lower in the skew VIX spread have produced market weakness.
Skew is a measure of how implied volatility is distributed. The lower the reading the less skewed the curve, indicating a normalized distribution.

Funds Flow
For the period ending March 21, 2013, $1.2 billion flowed into domestic equity funds while $6.0 billion flowed into both municipal and taxable bonds.
For the month of February, domestic equity funds had a net inflow of $1.3 billion while bond funds had a net inflow of $20.7 billion. For 2012, domestic equity funds had a net outflow of $149.3 billion while bonds funds had a net inflow of $295.4 billion.

Bottom Line
All equity indices are now flat and have entered a period of confluence. Any directional trades are viewed purely as a trade and not a sustainable trend. Equity markets have become extremely volatile and additional upside cannot be ruled out. Therefore it is advised that stops be honored, regardless of one's qualitative view. It is also important to watch the JPY, both futures and pairs to gauge overall risk sentiment.
About The Big Picture: All technical levels and trends are based upon Rethink Market Advisor models, which are price and momentum based. They do not use trend lines nor other traditional momentum studies. To learn more about how the models work, please click here or visit http://rethink-markets.com/model-profile
For a free two-week trial of any of our services, please send an email to info@rethink-markets.com and include "free trial" in the subject title.


