


Summary of My Post-CPI Tweets - by Michael Ashton - April 16, 2013
Below is a summary of my post-CPI tweets. You can follow me @inflation_guy.
-
Sigh. Not this month! Core #inflation +0.1%, waiting 4 data to see rounding. Big fall in apparel, & housing uptick not happening yet.
-
Apparel decline most since April 2001. That will reverse.
-
Core with rounding looks like 0.106%, 1.89% y/y. definitely weak. Will look at breakdown to see where.
-
This is the most that y/y has been below our forecast track since January 2009!
-
Core services fell from +2.6% y/y to +2.5%, but core goods fell to flat from +0.3%. Our thesis is that these will converge up, not down.
-
Core goods is inherently harder to forecast. Core services is largely housing.
-
Accelerating subgroups: Educ/Comm (6.8% of basket). Decel: Apparel, Transp, Food & Bev, Recreation (41.7%). Unch: Housing, Med Care, Other
-
CPI drooping appears to be seasonal maladjustment. The Apparel burp itself is worth 0.04%.
-
Housing - we're still waiting for the upturn. This month primary rents rose to 2.81% from 2.74% y/y, Lodging Away from Home rose too.
-
Owners' Equivalent Rent (24% of CPI) fell to 2.083% vs 2.144%. Since Primaries are rising, probably just a lag issue. 1 or 2 more months.
-
Apparel saw broad-based huge declines. Again, likely seasonal. Core decelerated 0.11%, and 0.06% of that was Apparel.
-
Our forecast for full-year CPI doesn't change as a result of this number. We're still at 2.6%-3.0% on core for 2013.
I don't want to overplay the Apparel card here. March is a big month for seasonal adjustment for Apparel, but it is possible that this marks the end of the two-year spike in Apparel prices. If it does, then it resolves one speculation I've had: that the rise in Apparel, after twenty years of flat-to-declining prices, indicated that in some areas the globalization dividend on inflation may have ended. It is far too early to say that speculation is wrong, especially with big seasonal adjustments in March. Prior to 1992, there were certainly setbacks in Apparel on a regular basis due to the difficulty in seasonal adjustment. So it's too early to say this is wrong, but not too early to say it's surprising. And, after all, there's always the possibility that the screwy numbers were the last twenty-three of them, and not this one. But these are still the highest seasonally-adjusted Apparel prices we've had in March since 2001 (see chart, source BLS, below).

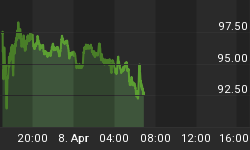
The small blip down in Housing is much less of a concern. Primary rents are still rising, and OER didn't exactly decline aggressively. We've been waiting out a "flat part" in the lag structure - this just means we have to wait another month or two. The chart below is updated (multiple sources) through this morning.

None of this will help the commodities guys, nor the TIPS guys, in the short run. But it doesn't change the big picture for inflation. It's coming. We just have to wait another month or two for the evidence!
You can follow me @inflation_guy!
Enduring Investments is a registered investment adviser that specializes in solving inflation-related problems. Fill out the contact form at http://www.EnduringInvestments.com/contact and we will send you our latest Quarterly Inflation Outlook. And if you make sure to put your physical mailing address in the "comment" section of the contact form, we will also send you a copy of Michael Ashton's book "Maestro, My Ass!"


