


The good news is:
• All of the major indices closed at multi year or all time highs on Friday.
The negatives
The market is overbought.
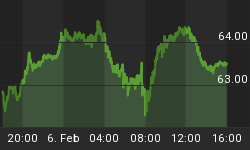
The chart below covers the past 2 weeks showing the major indices plotted on log scales to show their relative performance. A dark dashed vertical line has been drawn on the 1st trading day of the month; lighter dashed vertical lines have been drawn on the 1st trading day of each week.
The negative is the indices have been up 3% - 5.5% in the past 2 weeks.
A positive is the secondaries are leading the way up.

The next chart covers the past 6 months showing the NASDAQ composite (OTC) in blue and a 10% trend (19 day EMA) of NASDAQ new highs (OTC NH) in green. Dashed vertical lines have been drawn on the 1st trading day of each month.
OTC NH is a long way from confirming the new high in the index.

The next chart is similar to the one above except it shows the S&P 500 (SPX) in red and NY NH has been calculated from NYSE data.
NY NH is also failing to confirm the new SPX high.

New high non confirmations of new index highs are a common occurrence prior to cycle tops. The patterns shown above would be more frightening if the FED had not committed to continue or even expand its 85 billion monthly balance sheet expansion.
The positives
New highs across the index spectrum are bullish.
The chart below covers the past 6 months showing the OTC in blue and a 40% trend (4 day EMA) of NASDAQ new highs / (new highs + new lows) (OTC HL Ratio) in red. Dashed horizontal lines have been drawn at 10% levels for the indicator; the line is solid at the neutral 50% level.
OTC HL Ratio closed at a very strong 85% Friday. There are trading systems that impose a no sell filter when variations of this indicator are above 80%.

The chart below is similar to the one above except it shows SPX in red and NY HL Ratio, in blue, has been calculated from NYSE data.

NY HL Ratio closed at 95.6%.
Seasonality
Next week includes the 5 trading days prior to the 2nd Friday of May during the 1st year of the Presidential Cycle.
The tables below show the daily return on a percentage basis for the 5 trading days May during the 1st year of the Presidential Cycle.
OTC data covers the period from 1963 - 2012 and SPX data covers the period from 1953 - 2012. There are summaries for both the 1st year of the Presidential Cycle and all years combined. Prior to 1953 the market traded 6 days a week so that data has been ignored.
The coming week has been modestly positive during the 1st year of the Presidential Cycle and modestly negative over all years combined.
Report for the week before the 2nd Friday of May.
The number following the year is the position in the Presidential Cycle.
Daily returns from Monday to 2nd Friday.
| OTC Presidential Year 1 | ||||||
| Year | Mon | Tue | Wed | Thur | Fri | Totals |
| 1965-1 | -0.12% | -0.25% | -0.46% | 0.72% | -0.60% | -0.71% |
| 1969-1 | 0.34% | 0.19% | -0.38% | -0.02% | 0.32% | 0.45% |
| 1973-1 | -0.37% | 0.17% | -0.12% | -0.20% | -1.11% | -1.62% |
| 1977-1 | -0.14% | 0.41% | -0.25% | 0.04% | 0.46% | 0.53% |
| 1981-1 | -1.55% | -0.83% | 0.20% | 0.79% | 0.55% | -0.83% |
| 1985-1 | -0.16% | 0.37% | 0.06% | 0.78% | 1.48% | 2.53% |
| 1989-1 | -0.33% | -0.08% | 0.16% | 0.23% | 0.98% | 0.95% |
| Avg | -0.51% | 0.01% | 0.01% | 0.33% | 0.47% | 0.31% |
| 1993-1 | 0.20% | 0.04% | -0.20% | -0.89% | 0.11% | -0.74% |
| 1997-1 | 2.60% | -0.81% | -0.41% | 0.60% | 0.32% | 2.30% |
| 2001-1 | -0.82% | 1.16% | -1.92% | -1.28% | -1.01% | -3.87% |
| 2005-1 | 0.63% | -0.85% | 0.45% | -0.39% | 0.66% | 0.49% |
| 2009-1 | 2.58% | -0.54% | 0.28% | -2.44% | 1.33% | 1.22% |
| Avg | 1.04% | -0.20% | -0.36% | -0.88% | 0.28% | -0.12% |
| OTC summary for Presidential Year 1 1965 - 2009 | ||||||
| Avg | 0.24% | -0.09% | -0.21% | -0.17% | 0.29% | 0.06% |
| Win% | 42% | 50% | 42% | 50% | 75% | 58% |
| OTC summary for all years 1965 - 2012 | ||||||
| Avg | 0.05% | -0.09% | -0.02% | -0.09% | 0.04% | -0.11% |
| Win% | 54% | 50% | 52% | 58% | 58% | 54% |
| SPX Presidential Year 1 | ||||||
| Year | Mon | Tue | Wed | Thur | Fri | Totals |
| 1953-1 | 1.09% | 0.12% | -0.12% | -0.40% | 0.24% | 0.93% |
| 1957-1 | -0.15% | -0.30% | 0.39% | 0.11% | 0.50% | 0.54% |
| 1961-1 | -0.17% | 0.09% | -0.09% | -0.03% | 0.09% | -0.11% |
| 1965-1 | -0.21% | -0.12% | 0.44% | 0.37% | -0.19% | 0.28% |
| 1969-1 | 0.36% | 0.47% | -0.18% | 0.41% | -0.05% | 1.01% |
| Avg | 0.18% | 0.05% | 0.09% | 0.09% | 0.12% | 0.53% |
| 1973-1 | -0.42% | 0.65% | -0.73% | -0.81% | -1.25% | -2.57% |
| 1977-1 | -0.31% | 0.29% | -0.69% | -0.05% | 0.30% | -0.46% |
| 1981-1 | -1.54% | -0.27% | 0.35% | 0.68% | -0.01% | -0.79% |
| 1985-1 | -0.05% | 0.43% | -0.08% | 0.72% | 1.30% | 2.32% |
| 1989-1 | -0.52% | -0.26% | 0.20% | 0.38% | 2.24% | 2.03% |
| Avg | -0.57% | 0.17% | -0.19% | 0.18% | 0.52% | 0.11% |
| 1993-1 | 0.11% | 0.35% | 0.10% | -1.25% | 0.08% | -0.62% |
| 1997-1 | 2.13% | -0.31% | -1.47% | 0.63% | 0.49% | 1.48% |
| 2001-1 | -0.24% | -0.18% | -0.45% | -0.03% | -0.76% | -1.66% |
| 2005-1 | 0.64% | -1.07% | 0.42% | -1.00% | -0.46% | -1.47% |
| 2009-1 | 3.39% | -0.38% | 1.74% | -1.32% | 2.41% | 5.83% |
| Avg | 1.21% | -0.32% | 0.07% | -0.59% | 0.35% | 0.71% |
| SPX sumamry for Presidential Year 1 1953 - 2009 | ||||||
| Avg | 0.27% | -0.03% | -0.01% | -0.11% | 0.33% | 0.45% |
| Win% | 40% | 47% | 47% | 47% | 60% | 53% |
| SPX summary for all years 1953 - 2012 | ||||||
| Avg | 0.00% | 0.00% | -0.02% | -0.14% | 0.02% | -0.13% |
| Win% | 42% | 47% | 52% | 48% | 53% | 42% |
Money supply (M2)
The money supply chart was provided by Gordon Harms. Money supply growth appears to be declining. This seems odd considering the FED is injecting 85 billion a month into the economy.

Conclusion
The FED renewed its commitment to injecting, at least, 85b a month into the economy last week. Typically May, during the 1st year of the Presidential Cycle, has been the 2nd or 3rd strongest month of the year. But, the market is a little overbought right now and the average performance of the coming week has not been great.
I expect the major averages to be higher on Friday May 10 than they were on Friday May 3.
This report is free to anyone who wants it, so please tell your friends. They can sign up at: http://www.alphaim.net/signup.html. If it is not for you, reply with REMOVE in the subject line.
Good Luck,
YTD W 9/L 5/T 4


