


The following is part of Pivotal Events that was published for our subscribers May 9, 2013.
Signs Of The Times
"Manufacturing Contraction Deepens in April"
- Market Economics, May 1
Australian PMI plunged 7.7 points to 36.7, which is the lowest in 4 years.
"Automakers are giving subprime buyers the most long-term loans in at least eight years."
"Asset-backed sales linked to auto-debt are surging".
- Bloomberg, May 1
"The Market CDX North American Investment Grade Index, a credit-default swap...decreased to 71.4 bps...the lowest level since November 6, 2007."
- Bloomberg, May 3
That high for the S&P was 1565 on October 9th.
"Paul Krugman: Not Enough Inflation"
- The New York Times, May 2
A following chart on Spanish bond prices represents remarkable inflation in the prices of lower-grade bonds. It seems that the interventionist establishment is facing another opportunity to learn about "run-a-way-inflation". This is another one in financial assets and then they can have another lesson on the consequent deflation.
Perspective
How big can a market phenomenon get?
Of course, the great bubbles from the South Sea Bubble in 1720 to those of 1929 and 2007 are the really big ones. Other more specific examples include commodities and CPI inflation in 1980, junk-bonds in 1985 and tech-stocks in 2000. And then there was the great "new issues" market of 1962. Now called "IPOs", that one was so popular that anything could be placed and it is in the history books as the "Great Garbage" market.
That is nothing, not even a blip on the screen, compared to the game in lower-grade bonds. It has become the biggest Garbage Market in history.
If it was essentially a private mania it would be bad enough. But, this involves governments issuing huge amounts of risky paper while senior central bankers (who ought to know better) are aggressively buying them. And then there is the innocent investing public that is "reaching for yield". Of course, the most innocent of all is the non-participating taxpayer, who will have to pick up the tab for the party.
As we have been reviewing, the last time the establishment was so highly committed to an official narrowing of credit spreads was in 1998. The "official" part was that with the majesty of the European Union, spreads for different countries would narrow. After all, they would be under the wisdom and discipline of one central bank. It was called "Convergence".
Hot action continued into that fateful May when seasonal forces reversed to a widening trend. The LTCM disaster was discovered in August and the crash continued into October.
The trend to widening was confirmed by the gold/silver ratio breaking above 50 on May 11 and rising sharply later in the month. That along with European yields starting to increase was the warning on the disaster.
These "indicators" began to reverse to the positive side as the panic completed in October 1998.
The attached chart of the TED-Spread shows the key pattern in the spring of 2008.
Although on a smaller scale, a similar pattern has been developing this spring. A good test of the March "high" is underway. Technically, this is resistance and the turn down would be an important signal.
Turning down represents widening credit spreads.
This time around, the gold/silver ratio set a key low in February. That was the month that recorded the key low in 1998. Right now, the ratio is in the process of breaking out. A sharp rise through 63 would indicate another phase of liquidity problems.
Now some would ask how could there be another liquidity crisis when central bankers have the taps wide open?
One could ask the same question about commodities in 1980, junk-bonds in 1985 stocks in 2000 and the whole financial world in 2007.
The answer is that without speculators, the Fed cannot get its portion of a credit expansion out of the FMOC meetings. Speculative behaviour is becoming intense and on a path to reversal. Central bankers propose and market forces dispose.
Stock Markets
Last week, we reviewed the big "Rounding Top" pattern whereby various stock exchanges and sectors peak, but not at the same time. Also noted was that the Utilities were the latest important group to register very overbought conditions. The action has generated a Weekly Upside Exhaustion, which hasn't been seen since 2007. Also, a Sequential Sell pattern is completing.
Representing the big board, the S&P continues to rally. A couple of weeks ago we ran the chart of Gold/Commodities that showed the relation between its Weekly RSI on the G/C and the stock market highs. When the RSI gets as low as 30 the S&P is close to an important high. We thought it could take a couple of weeks, which counts out to around now.
On the downside, the long decline in base metal miners (SPTMN) reached 30 on the Weekly RSI and have been rebounding. At 860, there is substantial resistance at the 900 level. The low was 719.
We would continue to sell the overall rally as well as sectors, such as Utilities, as they become overbought.
Commodities
Since the "Momentum Peak" high in March-April 2011, base metals have declined from 502 to 333 on Friday. A rebound has been earned and anticipated by the low in the mining stocks three weeks ago. Unlikely to be an intermediate move, it could run for some weeks.
With the last summer's worst drought in fifty years, grains (GKX) soared to 533 - the most overbought since the high in early 2011 and at the cyclical peak in 2008. We thought that rallies for most items out of November would carry the grains, but that was not the case. GKX became somewhat oversold on the two-day plunge into April 1.
Stability around a narrow reading range has followed.
The Weekly is neutral, which suggests any rally attempts would be not be robust.
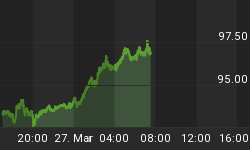
On crude oil, last week we noted that the rally had further to go on seasonal firming.
Momentum readings are neutral and the up could continue, but at 96.66 there is substantial resistance at 98 to 100.
Lumber set high Weekly and Daily Momentum readings at the first of the year. The high was 404 in March. The action broke down in early April, setting what could be an intermediate downtrend. At 336 the slump is becoming oversold on the Daily.
Taking out support at 325 would suggest the decline is cyclical.
Natural gas soared up to a Sequential Sell pattern in April at 4.44. This was noted by the ChartWorks and the decline has been to 3.89, yesterday.
There is support at this level, but momentum is neutral. Further decline seems possible. Some still think that central bank recklessness will drive commodities up. As reckless as they have been, they can't do it without speculators leveraging up against soaring asset prices. In 1980, soaring commodities carried that extraordinary credit expansion. The action was definitely not in bonds as they suffered the worst bear market in history.
Now the mania is in financial assets and not in commodities.
This is another phase of the new paradigm that we noted in 1981 - "No matter how much the Fed prints, financial assets will outperform commodities."
Quite likely, once the mania in lower-grade bonds blows out there may not be an asset class that speculators can enthuse about. In which case, no matter how much the Fed tries to print it may be overwhelmed by further declines in monetary velocity.
Currencies
A couple of weeks ago we thought that the DX should test the previous low of 81.78 and it did at 81.37.
Last night our thinking was that one more test of the 81 and change level was possible.
That stayed until 2 PM Eastern when the DX began a noteworthy jump - to 82.68 - which is a huge bar.
In quickly looking around, it was associated with a sharp rise in European yields. The Spanish note was up 10 bps to 4.19%.
Dollar up and Euro yields up - both dramatically is a warning on the ability of speculators to keep the games going.
It is interesting that as the former head of the Bank of Canada leaves to assume his new position as head of the Bank of England the C$ firms up and the pound weakens.
Just kidding, of course, but the C$ has firmed with the recent rebound in crude and copper. The Canadian unit is close to an overbought on the Daily.
Credit Markets
Lately, we have said very little about the yield curve. It was a very good indicator for us in timing the end of the manias in March 2000 and in May 2007. On the latter, the curve had reversed to steepening by the end of that fateful May. This prompted the line about "The greatest train wreck in the history of credit."
On those opportunities, the curve was expected to reverse to steepening, as with the end of the 1929 and 1873 bubbles.
In talking with Levente, the curve from 10s to 2s has been somewhat steep, within a trading range. But in this world of reckless policymaking we can't look for the curve to change from inverted to steepening to signal the change in the credit cycle.
Perhaps the action in the curve associated with the end of this mania will be different than usual. The "Bass-Ackwards" indicator?
It is possible that the yield curve in changing to flattening would be the warning signal.
As reviewed above, credit spreads are in the pattern that has anticipated the turn to credit concerns and the chart follows.
The bond future ran out of energy at 148.60 as the RSI got a little above 70. The decline to support at 145 is appropriate. Some stability at this level is possible, but investors should use the rallies to get defensive.
From May 16, 2013 issue of Pivotal Events:
PoliticsRarely in Western Democracies has the assault on individual freedom and prosperity been more intense. The social contract has been corrupted to bureaucrats telling the public what to do in exchange for taxes. This is not new and we have argued that, in reviewing previous examples of unlimited government, this experiment is becoming unusually ambitious. This is particularly evident in the US administration, which has been abusive of its power.
The IRS being revealed as a political operator is frightening and it did not do it on its own volition.
Political history records that such experiments in authoritarian government have run for some one hundred years. This has been the case. And then a frenzied burst of intrusion sets up the ending action. Somewhat like the climax of undisciplined speculation in financial or commodity markets.
A change in political reporting may have started with the eruption of White House scandals. First of all, the employment of all out "Chicago" politics and attendant corruption has always been part of the administration. "Chicago" has no place in the White House, not even in the basement.
What could be a big step towards reform is that the mainstream media, led by the Washington Post, stopped protecting the president and started some critical reporting.
Maybe there are real journalists in the MSM, rather than cheerleaders.
This page is not long enough to cover details, but it seems that the "Political Bubble" has been inflated to its limit and is about to implode.
On a much smaller scale a political bubble in British Columbia (where the IA Team lives) has just collapsed. Some six weeks before our provincial election, the polls had the socialist party ahead of the un-socialists by twenty percentage points.
Those who prefer freedom, including this writer, were appalled and were not going to vote. Friends who are amateur pundits had the governing party plunging to only 20 seats in an 85 seat legislature.
The un-socialist campaign dwelt upon the demands the socialists would impose on the taxpayers and pushed sound government. This writer voted on Tuesday and TV covered campaign headquarters for both parties as the polls closed at 8 PM.
The big ballroom for the un-socialist party was empty, because most thought the election had been lost.
Headquarters for the socialists was full of cheering party workers. That is until the first returns were reported with only 3 seats and 23 seats for the un-socialists. Instant dismay and gloom.
It got worse as when all the polls were in the un-socialists had won majority government with 50 seats. The socialists dropped two seats.
It is one of the fastest and most convincing changes in Canadian political history.
The instruction is that a platform of moderate government and a suddenly appealing leader can win over all of the passions about wind and solar power, bicycle lanes, mancaused global warming and no pipelines. The economic debate about intrusive government was decided in freedom's favour a long time ago.
Perhaps recent political events in the U.S. and British Colombia represent the start of much-needed reform.
Spanish Ten-Year Bond Price

- From straight down to straight up in only one year.
- If this was a stock or commodity, would you buy it?
Credit Spreads

- The update shows that the test of the high continues.
- The "test" is part of the pattern that has anticipated important changes in global credit markets.
- Breaking below .333 completes the pattern to indicating a significant reversal in credit conditions.
- From "Party" to "Hangover".
Link to January 12, 2013 'Bob and Phil Show' on TalkDigitalNetwork.com:
http://talkdigitalnetwork.com/2013/05/nikkei-jumps-gold-slumps


