


Stronger Than Expected
Before giving in to some late day selling, the stock market was holding up relatively well Monday given the negative drag from the budget talks in Washington. A positive offset came out of the Midwest. From MarketWatch:
Chicago PMI climbed in September to 55.7 from 53.0 in August. Economists polled by MarketWatch had expected the index, formally known the Chicago business barometer, to dip to 54.0. Readings above 50.0 indicate expansion. The Chicago PMI has risen three straight months and the latest increase is "consistent with modest economic growth,"
How Concerned Are The Markets?
From an economic perspective, market participants tend to vote with their investments. When concerns about future economic outcomes increase, investors tend to gravitate toward more conservative sectors, such as consumer staples. Below is a comparison of the current demand for defensive consumer staples relative to the S&P 500 during periods of crisis in 2011 and 2012. In 2011, the stock market plunged in August following a credit downgrade of U.S. debt. Demand for consumer staples starting increasing well before the stock market's waterfall decline.

Following the fiscal cliff scare in late 2012, the S&P 500 rallied significantly, which was in stark contrast to August 2011. The demand for defensive XLP was much tamer in late 2012, which foreshadowed a bullish start to 2013.

If we use 2011 as the bearish proxy and 2012 as the bullish proxy, the present day demand for defensive consumer staples relative to the S&P 500 tells us to keep an open mind about bullish outcomes once the situation in Washington calms down.

Expanding on the XLP theme above, this week's video presents concerns about waning bullish conviction in the short-term, but also shows the market's longer-term tolerance for risk is much higher than it was prior to the budget and debt induced plunge in stocks that occurred in the summer of 2011.
Little Tangible Progress In D.C.
Not surprisingly, the negotiations in our nation's capital are not complete with a deadline fast approaching. From Bloomberg:

Both parties in Congress dug in deeper hours before a midnight deadline to keep the government open, lobbing dead-end proposals and insults across the Capitol as the first partial shutdown in 17 years looked inevitable. The Senate voted 54-46 to reject the House's latest plan, in a move that puts the pressure back on House Republicans, who are insisting on tying changes in the 2010 Affordable Care Act to a short-term extension of government funding after tonight.
How Concerned Are Growth Investors?
Just as the relative performance of consumer staples told us something about the market's take on the economy, small caps provide similar insight from a different angle. Investors tend to shy away from small caps during periods of economic weakness. Demand for small caps (IWM) relative to the S&P 500 (SPY) was in a "we are not sure" holding pattern for eight months before the markets went to full bore risk-off mode in August 2011 (see orange box below).

During the fiscal cliff talks in late 2012 demand for small caps was increasing, which foreshadowed better days ahead for the markets.

The present day demand for small caps does not reflect the belief that the budget battle will derail the economy, meaning the ratio below looks more like late 2012 than August 2013.

Investment Implications: Short Term Vulnerabilities
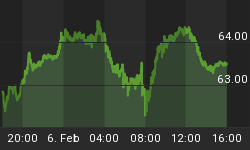
As noted Friday, we reduced our exposure to stocks last week due to observable deterioration in the market's tolerance for risk. We took another small incremental step Monday. Despite recent weakness in equities, the S&P 500 remains in an uptrend, as shown via the green line in the chart below. On the concerning side of the ledger, the slope of the 50-day moving average is on the verge of rolling over, which tells us the battle between the bulls and bears is relatively even from an intermediate-term perspective.

The market's pricing mechanism is telling us to respect the possibility of further weakness in stocks, but not to overreact. As shown in the chart above, if the S&P 500 drops to 1669 and/or 1663, buyers may step up.


