


Gold ran into trouble last week after an encounter with its important 150-day (30-week) moving average. The 150-day MA, which is an important psychological resistance barrier that is programmed into many Wall Street trading algorithms, was touched by gold a few days ago and was unable to overcome it. I've long maintained that the 150-day moving average is a psychologically significant benchmark for the gold ETF, both as a line of support and resistance. GLD's performance in recent days has confirmed this observation.
To illustrate the technical and psychological significance of the 150-day trend line, during the boom years between 2009 and 2011 gold and the gold ETF always respected the 150-day MA as the proverbial "line in the sand" during corrections in those years. During the entirety the 2009-2011 rally, the gold ETF never once penetrated the 150-day MA until late 2011 when the last bull swing ended.
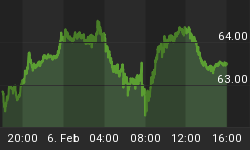
Sellers took the initiative away from the bulls and have been in control the last few days. The SPDR Gold Trust ETF (GLD), a reliable gold proxy, had an unsuccessful test of the 150-day MA on Oct. 31 as the following graph shows. As long as gold and the gold ETFs remain below the 150-day MA the bears can claim control over the intermediate-term trend. A close above the 150-day MA, however, would set up a re-test of the late August high and would be an inviting target for the bulls to complete a bottoming pattern that was begun four months ago.

Perhaps it's no coincidence that the bulls were given a fright in the days leading up to Halloween. In the spirit of the holiday, Lawrence Lewitinn of Yahoo Finance published an article today entitled, "Gold looks scary good," which contained an interview with MacNeil Curry of Bank of America Merrill Lynch. You may remember Curry, BoA's head of technical strategy, from his accurate prediction of the gold sell-off this past May when he forecast a price drop to as low as $1,250 an ounce for the month of June (gold eventually hit a low of $1,215 on a closing basis).
Despite heading into its first losing year since 2000, Curry believes gold is basing and may be on the cusp of heading higher to the tune of $180/oz. Curry told Yahoo's Lewitinn that the yellow metal may be headed as high as $1,500/oz. in the coming months. "In a recent note to investors," wrote Lewitinn, "Curry says moves over the past two weeks were reason for his reversal in outlook, writing:
'We have changed our view on gold from bearish to bullish. The impulsive gains from the 1251 low of Oct-15 and break of the 2m downtrend (confirmed on the break of 1330) say a medium term base and bullish turn is unfolding. We look for an ultimate break of the 1433 highs of Aug-28, with POTENTIAL for a push to 1500/1533 long term resistance. In the next several sessions we would buy a dip into 1309. THIS VIEW IS WRONG ON A BREAK BELOW 1251. For those awaiting additional confirmation of a turn, you need to see a break of 1375 (Sep-19 high & right shoulder off a multi-month Head and Shoulders Top).'
To validate his claim that the long-term bull market for gold remains intact, Curry highlighted the long-term monthly logarithmic chart for gold. He identified an uptrend line which the price of gold is about to come into contact with (see below). "This is still a long-term bull trend," said Curry. "There has been no damage to its long-term uptrend which began back at the turn of the century."

While I agree with Curry that the long-term uptrend for gold should remain intact, the likelihood of a push to the $1,500 level remains in doubt until the 150-day MA is broken on the upside (see GLD chart above). Until then the interim downtrend should be respected.
Many investors wonder why gold hasn't been able to get back into lock-step with the Dow in its march to higher levels since last year. The reason for the multi-year correlation between gold and stocks is succinctly described by Eric Hadik, editor of The INSIIDETrack. He writes: "Markets only follow other markets when the lead market is going parabolic or is in an extreme phase. Also, correlations are only effective when you can be CERTAIN of the current focus of traders."
After gold's parabolic blow-off in 2011, the yellow metal and the Dow have remain uncorrelated for lengthy periods. To restore a favorable attitude toward the metal by traders, equities will likely have to experience a setback and lose their preferred investment status - something that could happen in 2014 as the long-term Kress cycles make their final descent. This would make gold seem much more attractive as a safe haven by comparison.
As long as gold remains above the low established in late June, however, the intermediate-term basing pattern remains intact. The higher above the June low gold remains during the current pullback phase, the better will be gold's chances of resuming a sustained turnaround heading into 2014.
High Probability Relative Strength Trading
Traders often ask what is the single best strategy to use for selecting stocks in bull and bear markets? Hands down, the best all-around strategy is a relative strength approach. With relative strength you can be assured that you're buying (or selling, depending on the market climate) the stocks that insiders are trading in. The powerful tool of relative strength allows you to see which stocks and ETFs the"smart money" pros are buying and selling before they make their next major move.
Find out how to incorporate a relative strength strategy in your trading system in my latest book, High Probability Relative Strength Analysis. In it you'll discover the best way to identify relative strength and profit from it while avoiding the volatility that comes with other systems of stock picking. Relative strength is probably the single most important, yet widely overlooked, strategies on Wall Street. This book explains to you in easy-to-understand terms all you need to know about it. The book is now available for sale at:
http://www.clifdroke.com/books/hprstrading.html
Order today to receive your autographed copy along with a free booklet on the best strategies for momentum trading. Also receive a FREE 1-month trial subscription to the Gold & Silver Stock Report newsletter.


