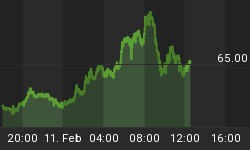
Forecast: For the December month, we were expecting a rally to All Time Highs into the 12/31-1/2 Major Time and Cycles (T&C) cluster CIT (Change in Trend).
Actual: We have made a 12/31/13 All time High so far.
The 12/31-1/-2 Time and Cycles Cluster:
Time:
1/01 Solar CIT => 12/31 High
2/31-1/02 double geometric CIT => 12/31 High
12/30: Sun Square Uranus Conjunct Pluto => 12/31 High
1/03/14 VIX Apex 1/03/14 Major Bradley
Cycles:
1. 140 TD Cycle (see chart above): 2/5/10L, 8/27/10L, 3/18/11L(-2), 10/6/11L(-2), 4/27/12H(+2), 11/16/12L, 6/10/13 miss, 12/30/13H => 12/31 High
2. 177 TD Cycle: 10/21/09H-173-7/1/10L-178-3/16/11L-177-11/25/11L-172-8/2/12L-177-4/18/13L-177-12/30/13 => 12/31 High
3. 55 TD Inverse cycle has 10/9L= 12/30H => 12/31 High
4. 99 hourly cycle due 12/31 = => 12/31 High
5. Banks Index has a regular 113 TD Cycle due 1/2/14 => 12/31 High
6. Many Lindsay Low Low High patterns:
a.7/08/09L-818-10/4/11L-818-12/30/13H => 12/31 High
b. 10/04/11L 409- 11/16/12L-409-12/30/13H => 12/31 High
c. 9/2/08H-972-5/2/11H-972-12/29/13H => 12/31 High
d. 4/28/42L, 3/1/78L, 1/2/14H => 12/31 High
7. Symmetry Point Cycle has 1/6/14 CIT
What's Next: We made a 12/31 High and have started a decline. There are some indications that we will see another High later on in January 2014. There are many that are comparing Nikkei 12/31/1989H and 9/3/1929H, with 12/31/2013H and some others are suggesting a mid Jan major High and a potential crash afterwards, but right now there are too many eyes on this Scenario making this unlikely to happen. We wish everyone the very best in the New year.


