


Not If, But When Next Big Drop Comes

As we noted on January 2, the market's current profile does not point to an imminent bear market in stocks. However, anyone who studies markets knows strong bull markets are inevitably followed by principal-destroying bear markets. When the market peaks, no one rings a bell; some investors will be prepared, some will not.

Do You Want To Give Back Three Years Of Gains?
When the dot-com bubble finally burst in 2000, three years of gains were wiped out. The final damage to principal was on the order of 51%, which is how far the S&P 500 dropped from the bull market peak to the bear market trough.

Eleven Years...Gone In A Flash
Similarly, after the property and mortgage bubble began losing air, the S&P gave back eleven years worth of gains. The final damage to principal was on the order of 58%, which is how far the S&P 500 dropped from the bull market peak to the bear market trough.

If We Know A Bear Is Coming
If it is inevitable a bear market is coming at some point in the future, is it not logical to start putting your protect-my-principal plans in place now? Obviously, the answer is yes.

On December 31, we showed how paying attention can add significant value in the world of investing. Today, we will show an admittedly simple hypothetical method for monitoring the stock market and making prudent adjustments to an allocation of stocks and bonds. The purpose is to show there are ways to monitor the markets and manage risk. Which method you choose is not of uppermost importance, but rather putting a rules-based and rational process in place before the next inevitable 20-50% drop in stocks arrives.
Fundamentals Reflected In Charts

The market's pricing mechanism, based on the aggregate opinion of every investor around the globe, allows us to compare present day economic confidence to historical confidence. If you prefer, a more direct way to say it is "charts enable us to monitor the conviction that stocks will push higher relative to the conviction that stocks will fall". The aggregate investor opinion is based on the aggregate interpretation of the economy, earnings, Fed policy, etc. The previous sentence helps us understand the concept that the fundamentals are reflected in the charts. Rules-based systems use market profiles based on observable evidence; the model allocates prudently based on the market's current profile.
If The Market Does This, Then I Adjust This Way
The best systems for investors help them discern between volatility to ignore (no action needed) and volatility to respect (defensive action needed). Our hypothetical asset allocation model uses five moving averages to help answer the primary volatility question in the previous sentence (see chart below). When the slopes of all the moving averages are positive, it indicates the battle between economic confidence and economic fear is being won by the bulls; this is a good time to be in stocks. When the slopes of all the moving averages are negative, the battle between economic confidence and economic fear is being won by the bears; this is a good time to be in defensive bonds. EMA stands for exponential moving average. SMA stands for simple moving average. Exponential moving averages are more sensitive to short-term changes in investor sentiment. The S&P 500 is shown in black below and the moving averages with colors.

We can build rules based on the observable, unbiased, and binary evidence. For illustrative purposes, let's assume these are our asset allocation rules: when all the answers to the questions in the table below are yes (1), then the model is in 100% stocks; when all the answers are no (0), which is indicative of a bearish trend, the model is in 100% bonds (or other conservative assets). Any market profile in between allocates between the extremes (100% stocks or 100% bonds are the extremes).

The chart of the S&P 500 below shows a fully bullish profile in October 2007 (see point A). Point B shows a fully bearish profile in January 2008. The hypothetical model would have incrementally reduced risk as the answers (observable evidence) changed. The model does not attempt to pick a top or forecast a top; rather it waits for evidence of a shift in the market's aggregate tolerance for risk. A key point is the evidence changes well before the waterfall plunge in 2008.

When Evidence Shifts, We Shift
The table below shows how the simple hypothetical model might handle a market with some hesitation from investors, but not enough to sound "we are concerned about a bear market" alarms. The allocation for the profile below might be 70% stocks and 30% bonds.

2009 Bottom - Observable Shift Took Place
The chart of the S&P 500 below shows the observable improvement that took place after the March 2009 low in stocks. When the moving averages turn back up, it tells us the aggregate outlook for the economy, earnings, and geopolitical events is improving. A key point is the observable evidence changes soon after the March 2009 low, allowing the model to capture gains. In January 2009 (point A below), the answer to all the questions is no, calling for a 100% conservative allocation. By the time we reach point C, the answer to all the questions is yes, calling for 100% exposure to stocks.

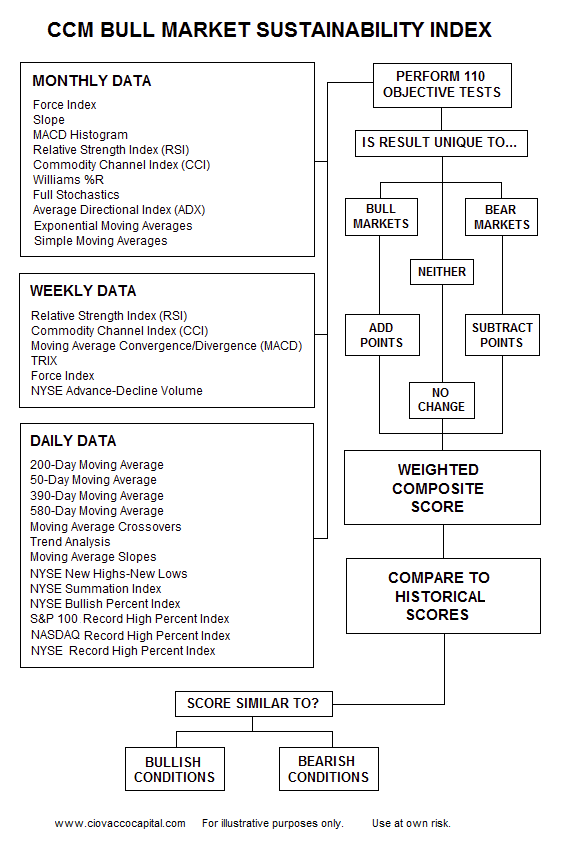
Indicator Diversification Reduces Whipsaws & Drawdowns
A whipsaw refers to an instance where a model gives you a buy signal, which is quickly followed by a sell signal. Any mathematical model is subject to whipsaws. We can reduce the frequency and severity of the whipsaws by diversifying our model with multiple markets, risk-on vs. risk-off ratios, time frames, and moving averages. The same can be said for inevitable drawdowns. Our rules-based market model uses submodel and indicator redundancy to address both of these valid and known concerns. This logic flow diagram provides an example of how models can diversify.
What Model Should I Use?
You should build a model or find a model that passes the "that makes sense to me" test. Any model should be thoroughly backtested. Strict rules are also necessary since a model is useless if you do not follow it 100% of the time (no exceptions). The beauty of the financial markets is there are countless ways to skin the risk-management cat.
Trading Costs and Taxes

Let's assume you had a $1,000,000 portfolio invested in the S&P 500 Index in October 2007. If your primary objective was to minimize taxes and trading costs, you would have lost 58% before the stock market bottomed on March 9, 2009. A loss of 58% equates to $580,000 in principal. Do you know how many trades we could pay for with $580,000? If you pay $8.95 per trade, the answer is over 64,000 trades. No one will ever approach anything even remotely close to 64,000 trades using a rules-based system for investors. Moral of the story, principal protection is infinitely more important than trading costs or tax implications. Many investors worry about pinching pennies rather than protecting dollars. Trading frequency and taxes are important, but they are not nearly as important as protecting your hard-earned principal.
Fed Always Important
Getting back to 2014, Friday brought some noteworthy statements by Fed Chairman Ben Bernanke. From Bloomberg:
"The combination of financial healing, greater balance in the housing market, less fiscal restraint, and, of course, continued monetary policy accommodation bodes well for U.S. economic growth in coming quarters," Bernanke said today in remarks prepared for a speech in Philadelphia. The chairman, who has led the central bank during its record quantitative-easing program, ends his eight-year tenure on Jan. 31. Bernanke said the decision to taper bond purchases "did not indicate any diminution of its commitment to maintain a highly accommodative monetary policy for as long as needed."
Investment Implications
Once the declines begin in the early stages of the next bear market, stress levels will begin to rise dramatically. We all make better decisions under low stress conditions. Therefore, now is the time to begin formulating your "inevitable bear market plan".

The articles below may spark some additional ideas during your plan development process:
- 2007/2013: You Will Never Look At The Markets The Same Way Again
- Tired Of Missing Rallies? 4 Ways To Improve Your Game
2014: Some Mild Deterioration
In early January 2014, the observable evidence, which is based on supply and demand, continues to call for an investment allocation with exposure to growth-oriented stocks. Therefore, until the evidence shifts meaningfully, we continue to hold our positions in U.S. equities (VTI), technology (QQQ), financials (XLF), energy (XLE), small caps (IWM), and global stocks (VT). Based on some mild deterioration in the market's risk profile, by rule, we did take a very small incremental step to reduce our exposure to stocks Friday, which increased our money market balances.


