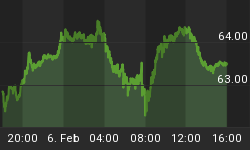
Review: In my last post, 3 weeks ago, on Jan 17, I was looking for a 1/17-21 swing High and start a decline that was part of a Panic Cycle. http://timeandcycles.blogspot.com/2014/01/the-active-panic-cycle.html
Actual: We made a 1/21 swing high and saw a sharp 111+ SP decline so far. The Panic cycle was looking for an initial 50-60 SP decline, but we more than doubled that, with more to come.
From the 2/4 Update: "We are extremely oversold, but the decline should continue into 2/5 Low+/-1 at the 2/4 Solar and or 2/6 geometric CIT. The Symmetry Point Cycle suggested a 1/21 High and a 2/6 Low. Mercury becomes Retrograde on 2/6 as well, which is often a CIT. Downside support is the 6/24/13L-10/9/13L trend line support at 1738 SPX and the 50% retrace at 1738 SPX."
Actual: The markets declined into a 2/5 Low, bottoming right at the 6/24/13L-10/09/13L Trend line support at 1738 SPX, at the 50% retrace from the 8/28/13L and 38% retrace from the 6/24/13L, both at 1738 SPX, 1 day after the 2/4 Solar CIT and 2/4 Squared Trading CIT and 1 day before the 2/6 geometric CIT, 2/6 SP Cycle CIT and 2/6 Mercury Retrograde CIT.
Squares in Trading days CITs
The above squares in Trading Days CIT is a Square of 9 timing technique that gives very precise Change in Trends (CIT), all dates are +/-1 TD.
1. 10/11/07H - 11/16/12L = 1285 Trading Days (TD), take the Square root of 1285 and you get: 35.85^2 (35.85 squared)
Now increment that number by 1 or 2 each time and re square to get future CITs:
2. 35.85+2 = 37.85^2 = 1433 TD + 10/11/07H = 6/24/13L
3. 35.85+3 = 38.85^2 = 1509 TD + 10/11/07H = 10/10/13L-1
4. 35.85+4 = 39.85^2 = 1588 TD + 10/11/07H = 2/04/14 +1 = 2/5/14 Low
Please note that 2/4 was also a Solar CIT, suggesting strongly that 2/4 +/- 1 TD was going to be an important CIT. This became the 2/5 Low as expected.
What's Next?: We made a 2/5 Low and should rally until the next swing High at the next proprietary Time and Cycle Cluster CIT, before we see yet another sharp decline.


