• 751 days Will The ECB Continue To Hike Rates?
  • 751 days Forbes: Aramco Remains Largest Company In The Middle East
  • 753 days Caltech Scientists Succesfully Beam Back Solar Power From Space
  • 1,153 days Could Crypto Overtake Traditional Investment?
  • 1,158 days Americans Still Quitting Jobs At Record Pace
  • 1,160 days FinTech Startups Tapping VC Money for ‘Immigrant Banking’
  • 1,163 days Is The Dollar Too Strong?
  • 1,163 days Big Tech Disappoints Investors on Earnings Calls
  • 1,164 days Fear And Celebration On Twitter as Musk Takes The Reins
  • 1,166 days China Is Quietly Trying To Distance Itself From Russia
  • 1,166 days Tech and Internet Giants’ Earnings In Focus After Netflix’s Stinker
  • 1,170 days Crypto Investors Won Big In 2021
  • 1,170 days The ‘Metaverse’ Economy Could be Worth $13 Trillion By 2030
  • 1,171 days Food Prices Are Skyrocketing As Putin’s War Persists
  • 1,173 days Pentagon Resignations Illustrate Our ‘Commercial’ Defense Dilemma
  • 1,174 days US Banks Shrug off Nearly $15 Billion In Russian Write-Offs
  • 1,177 days Cannabis Stocks in Holding Pattern Despite Positive Momentum
  • 1,178 days Is Musk A Bastion Of Free Speech Or Will His Absolutist Stance Backfire?
  • 1,178 days Two ETFs That Could Hedge Against Extreme Market Volatility
  • 1,180 days Are NFTs About To Take Over Gaming?
  1. Home
  2. Markets
  3. Other

SP500 Elliott Wave Analysis: Corrective Retracement

S&P500 has moved to a new high yesterday but then turned sharply down from 1845-1850 area where we were projecting a top zone for a complete five wave rally from 1732. As such, current reversal down is start of a minimum three wave retracement. Ideally this will be a simple zigzag that will look for a support around 1790-1800 zone after a retracement of 38.2% compared to recent bullish run.

S&P500 4h Elliott Wave Analysis
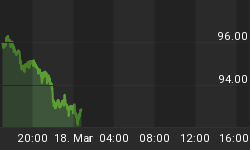
S&P500 4-Hour Elliott Wave Analysis Chart


S&P500 One Hour

The S&P found some support ahead of the US session, but we see move up as small rally within incomplete bigger three wave decline. We see price now moving into Fibonacci resistance area. Be aware of a new push down as long as market trades beneath the yesterday highs.

S&P500 1h Elliott Wave Analysis

S&P500 1-Hour Elliott Wave Analysis Chart


Written by www.ew-forecast.com
14 days trial just for €1 >> http://www.ew-forecast.com/register


Back to homepage

Leave a comment

Leave a comment