


Specific Answers Can Have Positive Impact On Net Worth
Weekends are a good time to address areas of vulnerability in your investment strategy. Many investors toss and turn at night worrying about wealth-destroying bear markets or opportunities they may miss for their uninvested cash, which is nature's way of pointing out vulnerabilities. When testing your current approach to the markets, it is helpful to look at extreme outcomes. If you can handle the extremes, then you can handle almost anything in between. Therefore, this weekend ask yourself:

Do I have specific plans in place to handle these extreme investment cases?
Case A: stocks rise an additional 91% over the next three years as they did during the final leg of the dot-com bubble (1997-2000).
Case B: stocks drop over 50% as they did in the 2000-2002 and 2007-2009 bear markets.
Where Are We Now?
In this article, we will show the monetary importance of case A and case B, and evaluate the present day market in relation to both cases. We'll wrap it up with a look at the most recent read of the fundamentals/geopolitical events and how all this impacts our current investment allocation.
Longer Than Rational Analysis Would Suggest
How could stocks possibly rise 91% between 2014 and 2016 with valuations already stretched? That is a rational question and one that was being asked in 1997. From a contingency planning perspective, it is best to always keep an open mind about upside and downside potential. The S&P 500's recent breakout from a 13-year consolidation pattern, described here, is another reason to keep an open mind about hard-to-comprehend gains.

Bull Markets Are Followed By Bear Markets
During a bear market, investors start to believe that stocks will never go up again. Conversely, the longer a bull market lasts, the harder it is to comprehend that a bear market will come at some point. When the next bear market begins is highly uncertain, but we know with 100% certainty that another bear market will eventually rear its ugly head. If we know a bear market is in our investment future, it is prudent to have specific plans in place.

The Math Says This Is An Important Topic
The left side of the table below shows pre-bear market portfolio values. The right side shows what happens after a 55% bear market is done with your account.

The left side of the table below shows pre-last stage of a bull market portfolio values. The right side shows what happens if you capture a euphoric and irrational 91% push higher. If the bullish 91% gain scenario were to play out, many would undoubtedly be underinvested. We reviewed the possible negative impact of being underinvested during the final stages of a bull market on January 16.

Does 2014 Look Like The Bear Market Case?
Before we can answer the question above, we need to use a few common tools to define what a bearish period looks like. In The Best 2014 Investment Advice, we highlighted the benefits of evaluating hard evidence in hand rather than trying to play the predicting the future game. Charts are a mechanism to monitor the aggregate interpretation of the fundamental data, which is what sets asset prices. When the aggregate opinion is "net bullish", stocks tend to rise and trends are bullish. Conversely, when the aggregate opinion is "net bearish", stocks tend to drop and trends are noticeably bearish. What did the observable evidence say during the S&P 500's 91% gain from 1997 to 2000? As you can see in the chart below, the evidence told us the aggregate interpretation of the fundamentals was "net bullish". The chart points out three bullish tendencies that are typically present during periods where the odds are in our favor.

What Does A Bearish Period Look Like?
To improve the odds of protecting our accounts during unfavorable periods, we must first define what a bearish period looks like. The chart below shows the same three concepts, but this time in a bear market context, where the aggregate read of the fundamentals is pessimistic.

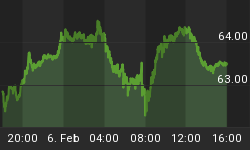
How Does 2014 Look?
The chart below shows the same three concepts as of the close on Thursday, February 20, 2014. You do not need to have any experience with technical analysis to see the present day looks nothing like a bear market and very much like a bull market. Are there reasons to believe the chart below could morph into a bearish look over time? Yes, we outlined three of them on February 20.

Latest Fundamental Data
Friday's economic calendar was light with a 10:00 am EST housing report being the headliner. The report continued a concerning trend of relatively weak economic reports. From MarketWatch:
Sales of existing homes fell 5.1% in January to a seasonally adjusted annual rate of 4.62 million, the slowest pace since July 2012, the National Association of Realtors reported Friday. Sales have trended down since the summer, hit by declining affordability and low inventory. Unusually poor weather may have also a played a role in January's drop, NAR said. Economists polled by MarketWatch had expected a January sales rate of 4.65 million, compared with a December rate of 4.87 million. The median sales price of used homes hit $188,900 in January, up 10.7% from the year-earlier period, supported by low inventory.
You Can Build A System

Regular readers know the system we use to address both case A and case B is the market model. If you are interested in learning more about converting observable evidence into an implementable risk-management system, Tired Of Missing Rallies? 4 Ways To Improve Your Game explains the basic concepts. Are using the 50-day and 200-day a foolproof way to monitor the markets? No, in fact, there is no such thing as a foolproof method to monitor the markets. However, the 50-day and 200-day do add value and they can improve our odds of success. Indicator and method redundancy can be used to diversify your system. For example, this flow diagram shows numerous inputs to one of our submodels.
Investment Implications - Overseas Stress Receding
While many Americans have been distracted with the Olympics, the recent bloodshed in the Ukraine has not escaped the eye of investors. Friday brought some much-needed good news. From Bloomberg:
Ukrainian protesters agreed to an offer from President Viktor Yanukovych to hold early presidential elections by December to halt a deadly three-month political crisis. Oleksiy Haran, a member of the demonstrators' Maidan Council, said by phone that the protesters "gave a mandate" to the opposition to sign the deal, which includes a new government and a return to the 2004 constitution within 48 hours, a step that would curb Yanukovych's powers. European Union foreign ministers worked all night in Kiev to broker a peace plan.
The aggregate read of all the fundamentals includes earnings, employment, housing, manufacturing, monetary policy, and fiscal policy. The 2014 chart in this article has a bullish look, which tells us the current aggregate interpretation of the fundamentals is bullish. Therefore, a growth-oriented allocation consisting of stocks (SPY) and leading sectors (QQQ) remains prudent. On February 20, we noted the S&P 500 has made little progress over the past eight weeks, which tells us economic conviction from the bulls is waning. Therefore, some risk-balancing bonds (TLT) and a larger than normal stash of cash are still on the books. Going forward, the observable evidence will guide us, if we are willing to monitor it in a disciplined and unbiased manner.


