


Gold went up and silver went down this week. It's natural for most people to say, "gold went up", but it's the most unnatural phenomenon. The dollar is paper scrip issued by the Fed. The fine print tells you that it's irredeemable, which is like a promise to give you a kilo of sugar that will never be honored. The quantity of this paper is rising while its quality is falling. Everyone knows that its value is unstable, and over long periods of time its value falls alarmingly. And yet we still presume to use this paper to measure the value of gold!
Amazing.
Anyways, in comparison to the undefined unit known as the dollar -- which we don't know if it moved up or down or sideways -- gold moved up. Gold went up by fourteen pieces of paper, engraved with the picture of George Washington. Silver -- by the moving and nonobjective reference point of copper clad zinc coins stamped with the image of Abraham Lincoln -- moved even more. Silver went down, and now it can be bought with a stack of those copper colored slugs that's 26 shorter than last week. We could as well say that silver went down by an inch and a half, because a stack of 26 pennies is about that tall.
Wouldn't it make more sense to say that the dollar went down by about a quarter of a milligram of gold?
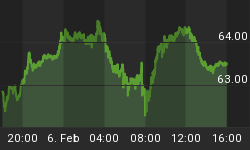
Here is the graph of the metals' prices.
The Prices of Gold and Silver
We are interested in the changing equilibrium created when some market participants are accumulating hoards and others are dishoarding. Of course, what makes it exciting is that speculators can (temporarily) exaggerate or fight against the trend. The speculators are often acting on rumors, technical analysis, or partial data about flows into or out of one corner of the market. That kind of information can't tell them whether the globe, on net, hoarding or dishoarding.
One could point out that gold does not, on net, go into or out of anything. Yes, that is true. But it can come out of hoards and into carry trades. That is what we study. The gold basis tells us about this dynamic.
Conventional techniques for analyzing supply and demand are inapplicable to gold and silver, because the monetary metals have such high inventories. In normal commodities, inventories divided by annual production can be measured in months. The world just does not keep much inventory in wheat or oil.
With gold and silver, stocks to flows is measured in decades. Every ounce of those massive stockpiles is potential supply. Everyone on the planet is potential demand. At the right price. Looking at incremental changes in mine output or electronic manufacturing is not helpful to predict the future prices of the metals. For an introduction and guide to our concepts and theory, click here.
Here is a graph of the gold price measured in silver, otherwise known as the gold to silver ratio. The ratio rose 1.44 points -- 2.3%. In other words, silver fell by about 11mg of gold.
The Ratio of the Gold Price to the Silver Price
The data has been showing for a long time that, while supply and demand in gold is slightly tight, it's loose in silver. Speculators are stretching the silver price higher by several dollars. When will they let go and let it snap back down to neutral, or even overshoot? It's hard to say, but the world seems to be in a credit contraction mode right now. There are ongoing declines in many currencies. Forget the Ukrainian hryvnia, Venezuelan bolivar, and Argentenian peso. It's also happening in the Brazilian real, Russian ruble, Indian rupee, and perhaps beginning in the Chinese yuan (and in many others too).
We will get to the point where people are desperate to get gold and silver and dump paper. That buying frenzy -- and accompanying collapse of almost everything else -- is still ahead of us. In the meantime, we appear now to be firmly in a period of squeezing the debtors.
The whole point of using leverage to buy gold or silver futures is speculation. The speculators are trying to front-run the real buyers of the metals -- the people who buy to take it home, and not sell regardless of price.
It may be due to the pressures of credit contraction. Or it's possible that silver demand is falling relative to gold because it has a substantial non-monetary (i.e. industrial) use and gold is almost purely monetary. Either way, the demand for silver metal, relative to the demand for gold metal, is quite a bit lower than it was a few years ago. The current silver price under $21 only partially reflects this fact.
For each metal, we will look at a graph of the basis and cobasis overlaid with the price of the dollar in terms of the respective metal. It will make it easier to provide terse commentary. The dollar will be represented in green, the basis in blue and cobasis in red.
Here is the gold graph.
The Gold Basis and Cobasis and the Dollar Price
The cobasis went sideways while the dollar fell (i.e. the price of gold rose). This suggests buyers of real metal, not speculators, led the price action this week. The neutral price of gold went up another twenty-five bucks, to around $1470.
Now let's look at silver.
The Silver Basis and Cobasis and the Dollar Price
Silver's pattern still hasn't really changed. We see a rise in the dollar price as measured in silver (i.e. a drop in the silver price as measured in dollars). And with this price move, we see the cobasis rise a bit. Silver futures were sold.
The cobasis is still quite negative.


