


Stock Market Direction
Choppy trading, which ruled the market for several weeks, ended Thursday afternoon. $60 Oil and record low VIX readings put a lot of pressure on traders, who had no choice, but to sell. A lot of it was profit taking, and some selling is attributed to momentum. As soon as 1215 was broken on September S&P futures, the market went straight down the rest of Thursday and all day Friday. Dow is leading the decline, which is what bulls want to see. I mentioned this many times in the past: any move up or down has a better credibility when it is led by high beta highly speculative stocks, because when traders believe in a trend they perceive that the best way to profit from it is to play stocks that historically move more. That's why you want to see NASDAQ lead a move higher or lower, rather than the Dow.
There are several important support levels right below the market. I don't want to turn bearish until they are broken. It is also important to watch the leadership. Mid-cap and small-cap stocks led the rally in May. It will be telling how these indexes handle this decline.
It is interesting to note that last three days of June are historically very positive. Also days before the FOMC announcement are usually positive. On top of that the market is short-term oversold and NASDAQ held relatively well during the sell off. Based on the above I am expecting S&P to find support around current levels or maybe a little lower and start a bounce, which should last into the FED meeting. 1185 - 1191 is viewed as support level on SPX, while 1200 and 1211 are resistance points. It would also be essential for the market to see GE to stabilize. It is going to be difficult to advance while the biggest stock in the world is in a free fall. Watch this stock for clues of short-term market direction.
S&P 500 (SPX), daily:

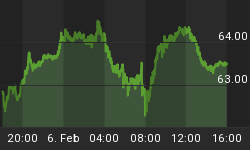
Dow Industrials, daily:

Today's Focus
As you well aware, our clients have been overweight energy stocks for a long time, which served as a great boost to the performance of long-term portfolios. I remain a long-term bull on energy and there is no reason to become bearish at least until the next presidential elections in the US. Being a long-term bull, however, does not mean that I expect oil stocks to continue to go straight up. You have seen me successfully trade oil futures and ETFs both ways on a short-term basis. There is a lot of concern in the financial markets regarding oil at $60. Yes it is certainly a concern, but the short-term indicators say that we are not too far away from some sort of a top.
Oil Futures, weekly:

The chart above indicates that open interest on futures (red line) is not confirming the recent new high. Also there is a negative divergence between oil futures and its derivatives like heating oil and unleaded gas.
The following chart point to the fact that oil stocks are sitting at important resistance level, which will be difficult to overcome, considering there is some momentum divergence.
XLE, weekly:

The above analysis suggests that energy assets might run into toping area somewhere at $60 or just above. I don't want to short oil or oil stocks, but hedging our energy exposure for our long-term clients seems like a good idea at these levels.
I would recommend writing covered calls or collars in your portfolio on all energy related issues using August or September at-the-money or out-of-the-money options. That is exactly what we are going to do for our clients.
For specific portfolio analysis, please contact me directly at dennis@themarkettraders.com
HAVE A PROFITABLE DAY!


