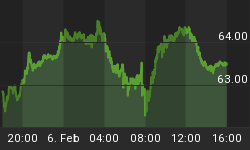
As of last Wednesday, the Dow has printed a double top. The time span between 12/31/13 and Wednesday's closing high is 92 days. A Fibonacci 38.2% of the distance between those two dates is 35 days and 35 days past 12/31/13 marked the closing low on 2/3/14.
In the weeks and months to come, the monthly Lindsay Report will spill a lot of ink to compare the current long cycle from 2002 and the 1921-1942 long cycle. After the high on 9/3/29 the market fell to a low on 11/13/29 before a 5-month rally which topped on 4/17/30. Those who thought the drop in 1929 was horrific didn't have the imagination to comprehend what was to come after April 1930. Similar to the 2/3/14 low, the low on 11/13/29 was 38.2% of the distance between the two highs in September 1929 and April 1930.
Lindsay described the period between the highs in 1929 and 1930 as a Sideways Movement. In the Lindsay literature a Sideways Movement is normally a topping formation in a bull market with both highs at, or near, the same level. In this case, the Dow printed a double top only in theory. In our current situation a double top looks for real. Fib or Fact?
Get your copy of the March Lindsay Report at SeattleTA.


