


On Tuesday, the Bureau of Labor Statistics will report the CPI index (along with endless other data) for March. Currently, the consensus estimate calls for +0.1%, and +0.1% ex-food-and-energy. This release will generate the usual irritation among conspiracy theorists who believe the government is monkeying with the inflation numbers for their own nefarious ends. I have previously explained why it is that inflation tends to feel faster than it actually is, and I have regularly debunked the claim by certain conspiracy-minded individuals that inflation has been running about 5% faster than the "official" mark since the early 1980s.[¹] However, today I want to point out another reason that right now we will have a tendency to recognize that inflation is not rising at 0.1% per month, and that involves the issue of seasonal adjustment.
The point of seasonal adjustment is to remove regular, cyclical influences so that we can see if the underlying trend is doing anything interesting. Consider temperature. Is it particularly helpful for you as a meteorologist to know that the average temperature in April has been higher than the average temperature in January? Of course not, because we know that April is always warmer than January. Hence, with temperature we ask whether April was warmer than a typical April.
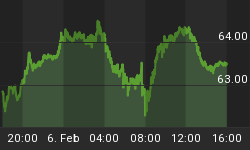
Closer to the point, consider gasoline. The national average gasoline price has risen in 61 of the last 66 days, as the chart below (Source: Bloomberg) illustrates.

Yes, if you're noticing that gasoline prices have been rising you are not alone, and it is not an illusion! But should we worry about this rapid acceleration in gasoline? Does this necessarily presage spiraling inflation? Bloomberg offers an easy way to look at the seasonality question (we formerly had to do this by hand). The following chart shows the change in gasoline prices (in cents) since December 31st for each of the last four years, for the 5-year average (the heavy, yellow line) and for this year (the white line).

You can see that the rise from late January into April is not only normal, but the scale of the increase is just about the same this year as for the prior four years - what was unusual was that prices didn't start rising until February.
Now, this particular seasonal pattern is important to inflation-watchers and TIPS traders because the volatility of gasoline prices is an important part of volatility in the overall price dynamic. In fact, it is important enough that if I take the average line from the gasoline chart above and overlay it with the official CPI seasonal adjustment factors from the BLS, you can see the ghost of the former in the latter (see chart, source Enduring Investments.)

Now, the seasonal adjustment factors for the CPI as a whole are less dramatic (closer to 1, in the chart above, if you look at the right-hand scale compared to the left-hand scale) than are the factors for gasoline, but that makes sense since gasoline is only a small part - albeit a really important part - of the consumption basket of the average consumer. And the BLS methodology is a lot more sophisticated than the simple average-of-the-last-x-years approach I have taken here. But this should be good enough for you to grasp the intuition.
What this means is that when the BLS reports tomorrow that gasoline prices didn't add anything to overall inflation in March, you should recognize that that does not mean that gasoline prices didn't rise in March. It means that they didn't rise significantly more or less than the average factor the BLS is assuming. Most of all, it doesn't mean that the BLS is monkeying with the data to make it seem lower. The product of the seasonal adjustment factors is (approximately) 1.0, which means that what the BLS takes away in the springtime, to report inflation numbers lower than would be anticipated given a raw sampling of store prices, they will give back in the late fall and winter, and report inflation numbers higher than would be anticipated given a cursory glance of store shelves. What is left, hopefully, is a more-unbiased view of what is happening with the price level generally.
Where you can see this effect most clearly is in the difference between the seasonally-adjusted number that is reported and the rise in the NSA figure that is used to adjust inflation-indexed bonds like TIPS. While the consensus calls for a +0.1% rise in headline CPI, the forecasts expect the NSA CPI (the price level) to rise from 234.781 to 236.017, which is a rise of +0.5%. So yes - if it feels like inflation is suddenly rising at a 6% annualized pace, that is because it is. But fear not, because that will slow down later in the year. Probably.
[¹] The summary of that argument: we know that wages have increased roughly 142% since the early 1980s - average hourly earnings was $8.45 in April 1984 and is $20.47 now, and this "feels about right" to most people. Against this, the CPI has risen 128%, meaning that our standard of living "should" have improved a little bit since then, but not much (although any individual may be doing somewhat better or worse). But if prices instead of rising at 2.8%/year had risen at 7.8%/year, prices in aggregate would have risen 851% versus a 142% increase in wages, and we would all be living in absolute squalor compared to our parents. This is offensively and obviously wrong.
You can follow me @inflation_guy!
Enduring Investments is a registered investment adviser that specializes in solving inflation-related problems. Fill out the contact form at http://www.EnduringInvestments.com/contact and we will send you our latest Quarterly Inflation Outlook. And if you make sure to put your physical mailing address in the "comment" section of the contact form, we will also send you a copy of Michael Ashton's book "Maestro, My Ass!"


