


4/30/2014 9:05:06 AM
Market awaits Fed policy statement...
Bulls continue to move equities higher but risk remains...
Recommendation: Take no action.
Click here to access our stock market chat rooms today! For a limited time, try our chat room for free. No subscription necessary to give it a try.
Stock Market Trends:

- ETF Positions indicated as Green are Long ETF positions and those indicated as Red are short positions.
- The State of the stock market is used to determine how you should trade. A trending market can ignore support and resistance levels and maintain its direction longer than most traders think it will.
- The BIAS is used to determine how aggressive or defensive you should be with an ETF position. If the BIAS is Bullish but the stock market is in a Trading state, you might enter a short trade to take advantage of a reversal off of resistance. The BIAS tells you to exit that ETF trade on "weaker" signals than you might otherwise trade on as the stock market is predisposed to move in the direction of BIAS.
- At Risk is generally neutral represented by "-". When it is "Bullish" or "Bearish" it warns of a potential change in the BIAS.
- The Moving Averages are noted as they are important signposts used by the Chartists community in determining the relative health of the markets.
Best ETFs to buy now (current positions):
Long DIA at $161.48 as of December 19, 2013
Long QQQ at $85.99 as of December 19, 2013
Long SPY at $181.19 as of December 19, 2013
Click here to learn more about my services and for our ETF Trend Trading.
Value Portfolio:
Long SDRL at $33.90 on June 15, 2012 (Shares were put to us when options expired. We were paid $1.10 per share when we sold those options and bought shares for $35.00 each). We have collected dividends: March 5, 2014 $0.98, December 3, 2013 $0.95, September 5, 2013 $0.91, June 5, 2013 $0.88, $1.70 Dec 4, 2012, $0.84 Sep 4, 2012. Total = $5.28 in dividend payments.
Short FXE at $124.19 on August 24, 2012
Long UUP at $22.43 on August 24, 2012
Short FXE at $134.48 on October 4, 2013
Long SDRL at $35.43 on Feb 18, 2014
Long SDRL at $33.50 on March 21, 2014 (Shares were put to us when options expired. We were paid $1.50 per share when we sold those options and bought the shares for $35.00 each.
We publish new reports to our free newsletter every month. If you're not a member, sign up by clicking here: Free Stock Market Newsletter
Equities gapped up at the open, rose for a half hour, then reversed to move to a price below the open but not enough to close the opening gap. An hour into the session, the bulls took over and forced prices higher into the afternoon. Depending on which equity index you monitored, prices peaked in the lunch hour through the late afternoon and all equity indexes saw some downside action in the final half hour to see the major indexes all close with fractional gains with the Dow and S&P-500 above their 20-, 50-, and 200-Day Moving Averages (DMAs) and the NASDAQ-100 above its 20- and 200-DMAs but below its 50-DMA. No equity index is in an uptrend state and the Russell 2000 (IWM 111.24 +0.28), the Regional Bank Index (KRE 38.25 -0.24), and the Bank Index (KBE 31.89 -0.01) are in downtrend states. The other equity indexes we regularly monitor closed higher and are in trading states. Longer Term Bonds (TLT 110.64 -0.15) slipped modestly. Trading volume was below average with 739M shares traded on the NYSE. Trading volume on the NASDAQ was average with 1.898B shares traded.
There were two economic reports of interest released:
- Case Shiller 20-City Index (Feb) rose +12.9% versus an expected +13.0% rise
- Consumer Confidence (Apr) came in at 82.3 versus an expected 83.6
The reports were released one half hour before and on half hour after the open respectively.
We are watching gold for a potential reversal in the Gold Miners Index (GDX 24.31 +0.32) added more than one percent and Gold (GLD 124.86 -0.02) closed flat. Both GDX and GLD closed below their respective 20-, 50-, and 200-DMAs.
Apple (AAPL 592.33 -1.76) struggled through the session and posted a modest loss. AAPL constitutes about 20 percent of the NASDAQ-100 and nearly five percent of the S&P-500.
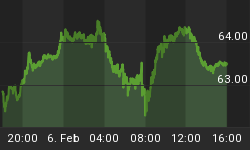
Seadrill Limited (SDRL 35.19 +0.51) closed nearly 1.5% after having been more than two percent higher intraday. It now trades above its 20- and 50-DMAs but below its 200-DMA and is in a trading state. We sold March 2014 $35.00 put contracts for $150 at the open on Feb 18th and bought shares at $35.43. The stock is now trading ex-dividend for $0.98. The shares were put to us at $35.00 less the $1.50 per share we were paid for the puts, so we have an effective price of $33.50.
The U.S. dollar rose one tenth of one percent while the Euro rose nearly three tenths of one percent.
The yield for the 10-year fell three basis points to close at 2.70. The price of a barrel of crude oil rose forty-six cents to close at $101.30.
The implied volatility for the S&P-500 (VIX 13.71 -0.26) slipped two percent and remains below its 20-, 50, and 200-DMAs. Implied volatility for the NASDAQ-100 (VXN 18.33 -0.41) slipped two percent remaining above its 50- and 200-DMAs and below its 20-DMA.
Market internals were bullish with advancers leading decliners 3:2 on the NYSE and by 11:10 on the NASDAQ. Up volume led down volume 2:1 on both the NYSE and the NASDAQ. The index put/call ratio rose +0.21 to close at 1.11. The equity put/call ratio fell -0.08 to close at 0.61.
Conclusion/Commentary
Tuesday saw nice rallies for the major indexes but the weakest equity indexes remain weak, i.e. the Russell-2000 and the bank indexes. While market internals were bullish, NASDAQ new lows were 2:1 over new highs for the last three sessions. In addition, the NASDAQ-100 has been weak versus the S&P-500 of late, which is bearish. We get the Fed announcement released on Wednesday at 2:00pm which generally sees a spike in volatility and could send equities sharply in one direction or the other. Usually, volatility is somewhat dampened going into the release of the policy statement then dramatic price moves occur for about ten minutes following the release before a directional move begins which lasts into the end of the session. What direction will that be and will it play out as per normal? No one can know at this time. We will watch to see how trading proceeds in the final two hours on Wednesday. Until then, we remain long.
We hope you have enjoyed this edition of the McMillan portfolio. You may send comments to mark@stockbarometer.com.


