


5/25/2014 6:33:33 PM
Market Summary
The S&P 500 index ended the week at a new closing high on Friday ending the week above 1,900 and just below the record 1,902 intraday high set on May 13th. The index had its first weekly gain in three weeks. In fact, 8 of the ten major S&P sectors closed higher on Friday and all of the other major indexes (DOW, S&P 500, Russell 2000 and Nasdaq) ended the week up. As seen in the Dow Jones Transportation Average weekly chart below, the transportation index closed the loop in the 'Dow Theory'. The 'Dow Theory' states the market is in an upward trend if one of its averages (industrial or transportation) advances above a previous important high, and it is accompanied or followed by a similar advance in the other. The DOW transportation index is one of the sectors that established a new high on Friday after the Dow Jones Industrial index hit its all-time high earlier in the month.

Recent Weekly Setup articles mentioned "Investors are concerned about weakness in small caps, biotech and technology sectors.The current bull market is on pace to becoming the fifth longest ever. As long as the current market doesn't crash before this upcoming Memorial Day. defensive sectors are leading the charge. It's this rotation to 'risk-off' stocks that we interpret to mean upside potential is limited over the next few months.at the updated year-to-date performance graph below, what is clear is that investors are seeking yield. Note the highest performing sectors are utilities, treasury bonds, and real estate which all provides high yields compared to all the other sectors..."

Over the past month as investors fear has diminished to a very low level, they have developed an appetite for risk. As seen in the updated 30-day graph below, investors are moving out of the higher yielding utilities and Treasury bond sectors back into high growth stocks like financials and technology.

Market Outlook
According to the Stock Trader's Almanac the days after Memorial Day have been rather bullish. May was the best month from 1985 to 1997, some of this bullishness after Memorial Day can be attributed to the strength of the first two days of June. In recent years, the Friday before Memorial day has become getaway day on The Street and volume is often diminished and trading uninspired. The May 18th Weekly Update mentioned "Another tool that we use to help confirm the overall market trend is the Momentum Factor ETF (MTUM) chart. Momentum Factor ETF is an investment that seeks to track the investment results of an index composed of U.S. large- and mid-capitalization stocks exhibiting relatively higher price momentum.The chart below confirms our analysis indicating large capitalization stocks are in a neutral trend." The updated Momentum Factor index chart below highlights a bullish price breakout. We have to see whether this is a confirmed move or simply a 'bull trap'.

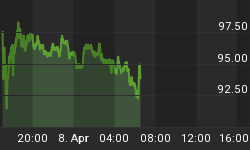
The updated graph below displays the VIX falling 5.6% this week to end at 11.36 which is the lowest level since March 2013. The current level is extremely low by historical standards and suggests investors are very complacent and are not concerned about market volatility. The low level of complacency is worrisome to some market watchers, but most likely indicates stock prices will remain stable.

Last week we said "AAII Sentiment Survey below, individual investors have gotten a little more bullish this past week but they are still overwhelmingly anticipating the market to remain neutral. As a contrarian sign, the bearish percentage is extremely low which suggest continued downside volatility because when stocks pull back; investors are caught off guard and rush in to close positions." The updated survey below shows individual investors are still predominantly neutral. What is interesting is even though the overall market went higher last week; individual investors are less bullish and more bearish. From a contrarian perspective this means stock prices should be expected to continue climbing higher as most individual investors are usually behind the curve predicting the market's direction.

The previous analysis of the National Association of Active Investment Managers said "NAAIM member exposure average is approx. 75% which is a moderately bullish level, but significantly lower than the ready reading from a few weeks ago.Risk has clearly increased in the market recently due to worries over the emerging markets." The updated graph below shows investment managers have gotten even less bullish over the past week. The green line shows the close of the S&P 500 Total Return Index on the survey date. The purple line depicts a two-week moving average of the NAAIM managers' responses. Last quarter the NAAIM Exposure Index reading averaged 84.40%, the current measure has sank all the way down to 67.23%. Professional money managers clearly are getting nervous about the market outlook, but if stocks keep moving higher investors might scramble to get back in, sending prices even higher.

Trading Strategy
Trading volume is usually below normal during the week of the Memorial holiday as the market will be closed on Monday and traders return from vacation. The summer months are typically slow with little expected to happen to shake the market from its current course. Our May 18th Weekly Setup opined "It appears investors are stepping up to the plate and scooping up some of the high-flying stocks that have dropped in price. While it is still relatively risky to trade a lot of the 'high momentum' stocks, if there are shares you really like, it might be worth the risk to buy in if you are prepared to ride out future volatility. Any bullish trades need to be hedged for downside protection as the current bull market is getting tired and traders have become quicker on the trigger with bidding down prices. Market neutral portfolio positioning is currently the best trading strategy to take advantage of prices vacillating between recent highs and support levels."
As we have wrote about recently, riskier stocks that comprise the Nasdaq 100 index (NDX) had been in a confirmed downtrend compared to the large capitalization DJIA and S&P500 indexes. The updated chart below indicates technology stocks are bouncing off a bottom and its shares are catching up with the large caps. This is further support for our comment above suggesting it is getting a little less risky to do bullish Nasdaq trades.

Last week we said "Similar to our analysis of the Nasdaq 100 index above, the small capitalization Russell 2000 (RUT) index is also in a downtrend compared to the large capitalization indexes. However, you can easily see the difference between the Nasdaq chart above and RUT below is the small cap index has not yet signaled a bottom and continues trending down. At this point, trading small capitalization stocks is more risky compared to the other major indexes." However, last week the Russell 2000 index beat the other major indexes gaining 1.1% for the week. You still need to wait on confirmation that the small cap index has found a support level after technically correcting the previous 6 weeks, or whether this a 'bull trap' where a false signal indicating that a declining trend in a stock or index has reversed and is heading upwards when, in fact, the security will continue to decline.

We talked about how "It is easy to see to see the continuing uptrend in the daily Treasury bond chart below. Treasury bonds are flashing overbought signals in the daily chart above." As discussed above, investors are starting to take on risky trades as Treasuries prices where due for a pullback from overbought levels.

We recent said "The trading axiom "the trend is your friend" is the way to play this market, as we said recently ".As the stock prices have stabilized we expect it will be easier to manage risks and more trade opportunities should be available." As discussed above, volatility is extremely low and the major indexes have been in a tight trading range with prices fluctuating between the top and bottom of the range. In the current environment, it is prudent to maintain tight stops with proper position sizing for long trades (whether bullish or bearish). As we have demonstrated in our trading newletters, spread trading works well in this market as the trades are less expensive and positions are protected if the trade goes against you. Generally, gains are limited when doing 'spreads', but this is not an issue in the current market where prices are basically moving sideways.
Regards,


